Washington Post - Chelsea Harvey
Greenland ice loss has recently contributed to twice as much sea-level rise than in the preceding two decades.
(Reuters)
It’s no news that Greenland is in serious trouble — but now, new research has helped quantify just how bad its problems are. A satellite study,
published last week in the journal Geophysical Research Letters,
suggests that the Greenland ice sheet lost a whopping 1 trillion tons of
ice between the years 2011 and 2014 alone. And a big portion of it came
from just five glaciers, about which scientists now have more cause to
worry than ever.
It’s
the latest story in a long series of increasingly worrisome studies on
ice loss in Greenland. Research already suggests that the ice sheet has
lost at least 9 trillion tons of ice
in the past century and that the rate of loss has increased over time.
Climate scientists are keeping a close eye on the region because of its
potentially huge contributions to future sea-level rise (around 20 feet
if the whole thing were to melt) — not to mention the damage it’s
already done. Ice loss from Greenland may have contributed as much as a
full inch of sea-level rise in the last 100 years and up to 10 percent
of all the sea-level rise that’s been documented since the 1990s.
The new study takes a detailed look at ice loss in Greenland between 2011 and 2014 using measurements from the CryoSat-2,
an environmental research satellite launched by the European Space
Agency in 2010. It relied on a type of measurement known as altimetry
— basically, measuring how the surface of Greenland’s altitude changed
over time in response to ice gains or losses.
“Simplistically, if the ice sheet’s going up, we can find that as evidence that the ice sheet is growing,” said lead author Malcolm McMillan,
a research fellow at the University of Leeds. “And where we see that
the ice sheet surface is lowering, we can find that the ice sheet is
losing ice.”
But he
cautioned that this is something of a simplification. The researchers
also had to consider how other factors such as snowfall — which would be
difficult to differentiate by satellite — might be affecting changes on
the surface of the ice sheet.
“Snow
and ice are at different densities, so they’re associated with a
different amount of mass loss,” McMillan explained. “We used a regional
climate model and a model of the surface of the ice sheet to really
inform us and tell us about the nature of the changes that we’re
seeing.”
Using this method
— combining the satellite observations with modeling — the researchers
found that the Greenland ice sheet lost mass at an average rate of about
269 billion tons per year from January 2011 through December 2014.
Altogether, this comes to about 1 trillion tons of ice loss over the
four-year period.
That
said, there were some major fluctuations from one year to the next — an
observation that University of Sheffield climate expert Edward Hanna
(who was not involved in the new study) said is one of the paper’s most
notable findings. The biggest losses were observed in 2012, when an
unusually warm summer helped bring about a loss of more than 400 billion
tons of ice. The next year, 2013, saw a comparatively modest loss of
just over 100 billion tons.
“There’s
not so many studies that do these sort of trend analyses or time
studies for the latest few years,” Hanna noted. “So it’s really trying
to assess how the ice sheet is responding to ongoing climate variability
or change.”
Overall, the
ice loss was particularly prevalent in the southwest, but the scientists
noted that there were also losses observed in the cooler, northern
parts of the ice sheet. Notably, the researchers also found that a solid
12 percent of all the ice loss came from just a handful of glaciers
composing less than 1 percent of the ice sheet’s total area.
Each
of these five glaciers flows outward into the sea, so that a
combination of both rising air temperatures and ocean temperatures
likely play a part in their ongoing retreat. Among these was the iconic
Jakobshavn glacier, a well-studied location now famous for its recent
massive ice losses. It’s been known to calve blocks of ice boasting
several square miles in surface area, as measured from above.
Scientists
were already fairly well aware of the massive losses being suffered by
these glaciers, McMillan acknowledged. But the finding helps reinforce
previous observations and drive home their disproportionate role in the
ice sheet’s contributions to sea-level rise. “Also … it means that going
forward, we’re able to kind of develop long-term and systematic records
that we can [use to] regularly monitor these glaciers and see how
they’re changing into the future,” he said.
In
fact, the study’s results match up reasonably well with measurements
taken by certain other satellites. After doing some comparisons, the
researchers found that data from NASA’s GRACE satellites,
for instance, suggest that Greenland is losing ice at a rate of about
287 billions tons per year. And according to Hanna, the results stand
well with scientists’ overall estimates of recent ice loss in Greenland,
which he says are consistently suggested to be around 250 billion tons
annually for the past few years.
In
this way, the study reinforces many beliefs that were already widely
held about Greenland’s precarious condition. But the techniques used to
do so may strengthen future measurements, which will be used to inform
the climate models that help scientists make predictions about how the
ice sheet will behave in the future — a crucial step in determining the
amount of sea-level rise we might expect over any given time period.
“I
guess the most significant or the most novel aspect of the study is
really the resolution or the detail that we’re able to measure,”
McMillan said. “Although satellite techniques give us a holistic view of
how the ice sheet as a whole is changing, what we’re able to do by
using this specific technique is identify specific regions that are
changing. And that’s really important because it kind of gives us more
of an idea of the processes that are causing the changes.”
Links

2016 On Pace To Be Hottest Year Ever As Climate Change Trends Reach ‘New Climax’– UN
UN News Centre
Global temperatures for the first six months of this year reached new
highs, setting 2016 on track to be the hottest-ever on record, the
United Nations weather agency said today.
"Another month, another record. And another. And another. Decades-long trends of climate change are reaching new climaxes, fuelled by the strong 2015/2016 El Niño," said World Meteorological Organization (WMO) Secretary-General Petteri Taalas in a press release.
The El Niño event, which turned up the Earth's thermostat, has now disappeared, but "climate change, caused by heat-trapping greenhouse gases, will not," he stressed. This means more heatwaves, more extreme rainfall and potential for higher impact tropical cyclones.
Arctic sea ice melted early and fast, another indicator of climate change. Carbon dioxide levels, which are driving global warming, have reached new highs.
To calculate global temperature statistics for its annual state of the climate report, WMO uses datasets from the US National Oceanic and Atmospheric Administration (NOAA), the United States National Aeronautics and Space Administration's Goddard Institute for Space Studies (NASA GISS), and the UK's Met Office and reanalysis data from the European Centre for Medium Range Weather Forecasting (ECMWF).
Two separate reports from NOAA and NASA GISS both highlighted the dramatic and sweeping changes in the state of the climate.
June 2016 marked the 14th consecutive month of record heat for land and oceans. It marked the 378th consecutive month with temperatures above the 20th century average. The last month with temperatures below the 20th century average was December 1984.
Carbon dioxide concentrations have passed the symbolic milestone of 400 parts per million in the atmosphere so far this year. CO2 levels vary according to the season, but the underlying trend is upwards. They showed a surprising increase for the first half of 2016, rising in June 2016 to nearly 407 ppm, 4 ppm greater than June 2015.
"This underlines more starkly than ever the need to approve and implement the Paris Agreement on climate change, and to speed up the shift to low carbon economies and renewable energy," said Mr. Taalas.
 UN Secretary-General Ban Ki-moon has invited leaders to a special event on 21 September to deposit their instruments of ratification, acceptance, approval or accession to the Paris Agreement
on climate change, which was adopted by last December. The event will
also provide an opportunity to other countries to publicly commit to the
agreement before the end of 2016.
UN Secretary-General Ban Ki-moon has invited leaders to a special event on 21 September to deposit their instruments of ratification, acceptance, approval or accession to the Paris Agreement
on climate change, which was adopted by last December. The event will
also provide an opportunity to other countries to publicly commit to the
agreement before the end of 2016.
It's getting hotter
The average temperature in the first six months of 2016 was 1.3 degrees Celsius (2.4 degrees Fahrenheit) warmer than the pre-industrial era in the late 19th century, according to NASA.
NOAA said the global land and ocean average temperature for January–June was 1.05 degrees Celsius (1.89 degrees Fahrenheit) above the 20th century average, beating the previous record set in 2015 by 0.20 degree Celsius (0.36 degree Fahrenheit).
Each month in 2016 was record warm. Most of the world's land and ocean surfaces had warmer to much-warmer-than-average conditions.
The El Niño event which developed in 2015 and was one of the most powerful on record contributed to the record temperatures in the first half of 2016. It dissipated in May.
Arctic Sea ice is melting faster
The extent of Arctic sea ice at the peak of the summer melt season now typically covers 40 per cent less area than it did in the late 1970s and early 1980s. Arctic sea ice extent in September, the seasonal low point in the annual cycle, has been declining at a rate of 13.4 per cent per decade.
Depending on where you are, it's either too wet or too dry
Rainfall in June 2016 varied significantly around the world. It was notably drier than normal across the western and central contiguous US, Spain, northern Colombia, northeastern Brazil, Chile, southern Argentina, and across parts of central Russia.
Wetter-than-normal precipitation was observed across northern Argentina, northern and central Europe, much of Australia, and across central and southern Asia.
From January to 4 July, China saw 21.2 per cent above average precipitation. South China entered the flood season on 21 March, 16 days earlier than normal and more than 150 counties were record wet, according to the China Meteorological Administration. More than 300 rivers crossed the water level warning mark.
Coral reefs are under increasing threat
Temperatures in the Coral Sea (including the Great Barrier Reef), and the Tasman Sea were highest on record for extended periods since late summer 2016, according to Australia's Bureau of Meteorology.
These warm waters have also contributed to surface temperature warmth over Australia and unprecedented bleaching of the Great Barrier Reef, according to Australia's independent Climate Council. There has been widespread bleaching of reefs in many other parts of the world.
Links
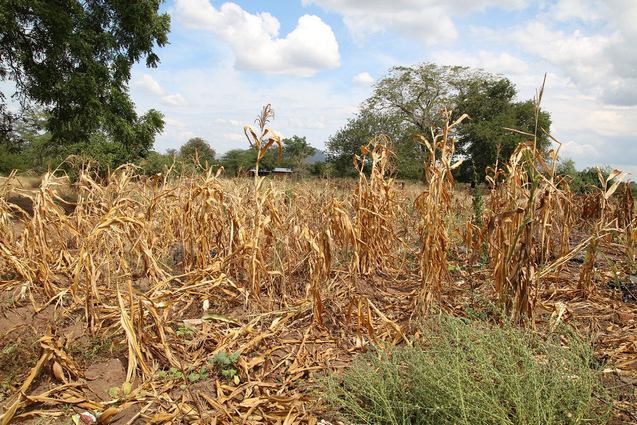 |
| Wilted crops in Neno district, Malawi. Photo: OCHA/Tamara van Vliet |
"Another month, another record. And another. And another. Decades-long trends of climate change are reaching new climaxes, fuelled by the strong 2015/2016 El Niño," said World Meteorological Organization (WMO) Secretary-General Petteri Taalas in a press release.
The El Niño event, which turned up the Earth's thermostat, has now disappeared, but "climate change, caused by heat-trapping greenhouse gases, will not," he stressed. This means more heatwaves, more extreme rainfall and potential for higher impact tropical cyclones.
Arctic sea ice melted early and fast, another indicator of climate change. Carbon dioxide levels, which are driving global warming, have reached new highs.
To calculate global temperature statistics for its annual state of the climate report, WMO uses datasets from the US National Oceanic and Atmospheric Administration (NOAA), the United States National Aeronautics and Space Administration's Goddard Institute for Space Studies (NASA GISS), and the UK's Met Office and reanalysis data from the European Centre for Medium Range Weather Forecasting (ECMWF).
 |
| Secretary-General Ban Ki-moon (second from left) in discussion with Petteri Talaas, Secretary-General of the World Meteorological Organization (WMO), at the WMO Headquarters in Geneva, Switzerland. UN Photo/Rick Bajornas. |
June 2016 marked the 14th consecutive month of record heat for land and oceans. It marked the 378th consecutive month with temperatures above the 20th century average. The last month with temperatures below the 20th century average was December 1984.
Carbon dioxide concentrations have passed the symbolic milestone of 400 parts per million in the atmosphere so far this year. CO2 levels vary according to the season, but the underlying trend is upwards. They showed a surprising increase for the first half of 2016, rising in June 2016 to nearly 407 ppm, 4 ppm greater than June 2015.
"This underlines more starkly than ever the need to approve and implement the Paris Agreement on climate change, and to speed up the shift to low carbon economies and renewable energy," said Mr. Taalas.
UN Secretary-General Ban Ki-moon has invited leaders to a special event on 21 September to deposit their instruments of ratification, acceptance, approval or accession to the Paris Agreement
on climate change, which was adopted by last December. The event will
also provide an opportunity to other countries to publicly commit to the
agreement before the end of 2016.It's getting hotter
The average temperature in the first six months of 2016 was 1.3 degrees Celsius (2.4 degrees Fahrenheit) warmer than the pre-industrial era in the late 19th century, according to NASA.
NOAA said the global land and ocean average temperature for January–June was 1.05 degrees Celsius (1.89 degrees Fahrenheit) above the 20th century average, beating the previous record set in 2015 by 0.20 degree Celsius (0.36 degree Fahrenheit).
Each month in 2016 was record warm. Most of the world's land and ocean surfaces had warmer to much-warmer-than-average conditions.
The El Niño event which developed in 2015 and was one of the most powerful on record contributed to the record temperatures in the first half of 2016. It dissipated in May.
Arctic Sea ice is melting faster
The extent of Arctic sea ice at the peak of the summer melt season now typically covers 40 per cent less area than it did in the late 1970s and early 1980s. Arctic sea ice extent in September, the seasonal low point in the annual cycle, has been declining at a rate of 13.4 per cent per decade.
 |
| A view from Secretary-General Ban Ki-moon's small plane on arrival in King George Island, Antarctica. The Secretary-General traveled to Antarctica to see the effects of climate change on melting glaciers. |
Rainfall in June 2016 varied significantly around the world. It was notably drier than normal across the western and central contiguous US, Spain, northern Colombia, northeastern Brazil, Chile, southern Argentina, and across parts of central Russia.
Wetter-than-normal precipitation was observed across northern Argentina, northern and central Europe, much of Australia, and across central and southern Asia.
From January to 4 July, China saw 21.2 per cent above average precipitation. South China entered the flood season on 21 March, 16 days earlier than normal and more than 150 counties were record wet, according to the China Meteorological Administration. More than 300 rivers crossed the water level warning mark.
Coral reefs are under increasing threat
Temperatures in the Coral Sea (including the Great Barrier Reef), and the Tasman Sea were highest on record for extended periods since late summer 2016, according to Australia's Bureau of Meteorology.
These warm waters have also contributed to surface temperature warmth over Australia and unprecedented bleaching of the Great Barrier Reef, according to Australia's independent Climate Council. There has been widespread bleaching of reefs in many other parts of the world.
Links
- With hottest April on record, streak of above-average global temperatures continues – UN
- UN chief invites leaders to fast-track ratification of Paris climate deal
- Trees contribute to reducing carbon footprints even after being cut down – UN report
- Ban urges burden-sharing, solidarity to combat effects of El Niño and mitigate climate change
A Brief History Of Fossil-Fuelled Climate Denial
The Conversation -
The fossil fuel industry has spent many millions of dollars
on confusing the public about climate change. But the role of vested
interests in climate science denial is only half the picture.
Interest in this topic has spiked with the latest revelation regarding coalmining company Peabody Energy. After Peabody filed for bankruptcy earlier this year, documentation became available revealing the scope of Peabody's funding to third parties. The list of funding recipients includes trade associations, lobby groups and climate-contrarian scientists.
This latest revelation is significant because in recent years, fossil fuel companies have become more careful to cover their tracks. An analysis by Robert Brulle found that from 2003 to 2010, organisations promoting climate misinformation received more than US$900 million of corporate funding per year.
However, Brulle found that from 2008, open funding dropped while funding through untraceable donor networks such as Donors Trust (otherwise known as the "dark money ATM") increased. This allowed corporations to fund climate science denial while hiding their support.
The decrease in open funding of climate misinformation coincided with efforts to draw public attention to the corporate funding of climate science denial. A prominent example is Bob Ward, formerly of the UK Royal Society, who in 2006 challenged Exxon-Mobil to stop funding denialist organisations.
John Cook interviews Bob Ward at COP21, Paris
The veils of secrecy have been temporarily lifted by the Peabody bankruptcy proceedings, revealing the extent of the company's third-party payments, some of which went to fund climate misinformation. However, this is not the first revelation of fossil fuel funding of climate misinformation – nor is it the first case involving Peabody.
In 2015, Ben Stewart of Greenpeace posed as a consultant to fossil fuel companies and approached prominent climate denialists, offering to pay for reports promoting the benefits of fossil fuels. The denialists readily agreed to write fossil-fuel-friendly reports while hiding the funding source. One disclosed that he had been paid by Peabody to write contrarian research. He had also appeared as an expert witness and written newspaper op-eds.
John Cook interviews Ben Stewart, Greenpeace at COP21, Paris.
The bigger picture of fossil-fuelled denial
Peabody's funding of climate change information and misinformation is one episode in a much larger history of fossil-fuel-funded misinformation. An analysis of more than 40,000 texts by contrarian sources found that organisations who received corporate funding published more climate misinformation, a trend that increased over time.
The following figure shows the use of the claim that "CO₂ is good" (a favourite argument of Peabody Energy) has increased dramatically among corporate-funded sources compared with unfunded ones.
In 1991, Western Fuels Association combined with other groups representing fossil fuel interests to produce a series of misinformation campaigns. This included a video
promoting the positive benefits of carbon dioxide, with hundreds of
free copies sent to journalists and university libraries. The goal of
the campaign was to "reposition global warming as theory (not fact)",
attempting to portray the impression of an active scientific debate
about human-caused global warming.
ExxonSecrets.org has been tracking fossil-fuel-funded misinformation campaigns for more than two decades – documenting more than A$30 million of funding from Exxon alone to denialist think tanks from 1998 to 2014.
Exxon's funding of climate science denial over this period is particularly egregious considering that it knew full well the risks from human-caused climate change. David Sassoon, founder of Pulitzer Prize-winning news organisation Inside Climate News led an investigation into Exxon's internal research, discovering that its own scientists had warned the company of the harmful impacts of fossil fuel burning as long ago as the 1970s.
John Cook interviews David Sassoon from Inside Climate News.
Even Inside Climate News's revelation of industry's knowledge of the harmful effects of climate change before engaging in misinformation campaigns has precedence. In 2009, an internal report for the Global Climate Coalition, a group representing fossil fuel industry interests, was leaked to the press.
It showed that the coalition's own scientific experts had advised it in 1995 that "[t]he scientific basis for the Greenhouse Effect and the potential impact of human emissions of greenhouse gases such as CO₂ on climate is well established and cannot be denied". Nevertheless, the organisation proceeded to deny climate science and promote the benefits of fossil fuel emissions.
Ideology: the other half of an "unholy alliance"
However, to focus solely on industry's role in climate science denial misses half the picture. The other significant player is political ideology. At an individual level, numerous surveys (such as here, here and and here) have found that political ideology is the biggest predictor of climate science denial.
People who fear the solutions to climate change, such as increased regulation of industry, are more likely to deny that there is a problem in the first place – what psychologists call "motivated disbelief".
Consequently, groups promoting political ideology that opposes market regulation have been prolific sources of misinformation about climate change. This productivity has been enabled by the many millions of dollars flowing from the fossil fuel industry. Naomi Oreskes, co-author of Merchants of Doubt, refers to this partnership between vested interests and ideological groups as an "unholy alliance".
Reducing the influence
To reduce the influence of climate science denial, we need to understand it. This requires awareness of both the role of political ideology and the support that ideological groups have received from vested interests.
Without this understanding, it's possible to make potentially inaccurate accusations such as climate denial being purely motivated by money, or that it is intentionally deceptive. Psychological research tells us that ideologically driven confirmation bias (misinformation) is almost indistinguishable from intentional deception (disinformation).
Video from free online course Making Sense of Climate Science Denial (launches August 9).
The fossil fuel industry has played a hugely damaging role in promoting misinformation about climate change. But without the broader picture including the role of political ideology, one can build an incomplete picture of climate science denial, leading to potentially counterproductive responses.
Links
 |
| Fossil fuel industry-funded organisations have played a big role in climate denial. Coal power image from www.shutterstock.com |
Interest in this topic has spiked with the latest revelation regarding coalmining company Peabody Energy. After Peabody filed for bankruptcy earlier this year, documentation became available revealing the scope of Peabody's funding to third parties. The list of funding recipients includes trade associations, lobby groups and climate-contrarian scientists.
This latest revelation is significant because in recent years, fossil fuel companies have become more careful to cover their tracks. An analysis by Robert Brulle found that from 2003 to 2010, organisations promoting climate misinformation received more than US$900 million of corporate funding per year.
However, Brulle found that from 2008, open funding dropped while funding through untraceable donor networks such as Donors Trust (otherwise known as the "dark money ATM") increased. This allowed corporations to fund climate science denial while hiding their support.
The decrease in open funding of climate misinformation coincided with efforts to draw public attention to the corporate funding of climate science denial. A prominent example is Bob Ward, formerly of the UK Royal Society, who in 2006 challenged Exxon-Mobil to stop funding denialist organisations.
John Cook interviews Bob Ward at COP21, Paris
The veils of secrecy have been temporarily lifted by the Peabody bankruptcy proceedings, revealing the extent of the company's third-party payments, some of which went to fund climate misinformation. However, this is not the first revelation of fossil fuel funding of climate misinformation – nor is it the first case involving Peabody.
In 2015, Ben Stewart of Greenpeace posed as a consultant to fossil fuel companies and approached prominent climate denialists, offering to pay for reports promoting the benefits of fossil fuels. The denialists readily agreed to write fossil-fuel-friendly reports while hiding the funding source. One disclosed that he had been paid by Peabody to write contrarian research. He had also appeared as an expert witness and written newspaper op-eds.
John Cook interviews Ben Stewart, Greenpeace at COP21, Paris.
The bigger picture of fossil-fuelled denial
Peabody's funding of climate change information and misinformation is one episode in a much larger history of fossil-fuel-funded misinformation. An analysis of more than 40,000 texts by contrarian sources found that organisations who received corporate funding published more climate misinformation, a trend that increased over time.
The following figure shows the use of the claim that "CO₂ is good" (a favourite argument of Peabody Energy) has increased dramatically among corporate-funded sources compared with unfunded ones.
 |
| Prevalence of denialist claim from corporate funded and non-funded sources. Farrell (2015) |
ExxonSecrets.org has been tracking fossil-fuel-funded misinformation campaigns for more than two decades – documenting more than A$30 million of funding from Exxon alone to denialist think tanks from 1998 to 2014.
Exxon's funding of climate science denial over this period is particularly egregious considering that it knew full well the risks from human-caused climate change. David Sassoon, founder of Pulitzer Prize-winning news organisation Inside Climate News led an investigation into Exxon's internal research, discovering that its own scientists had warned the company of the harmful impacts of fossil fuel burning as long ago as the 1970s.
John Cook interviews David Sassoon from Inside Climate News.
Even Inside Climate News's revelation of industry's knowledge of the harmful effects of climate change before engaging in misinformation campaigns has precedence. In 2009, an internal report for the Global Climate Coalition, a group representing fossil fuel industry interests, was leaked to the press.
It showed that the coalition's own scientific experts had advised it in 1995 that "[t]he scientific basis for the Greenhouse Effect and the potential impact of human emissions of greenhouse gases such as CO₂ on climate is well established and cannot be denied". Nevertheless, the organisation proceeded to deny climate science and promote the benefits of fossil fuel emissions.
Ideology: the other half of an "unholy alliance"
However, to focus solely on industry's role in climate science denial misses half the picture. The other significant player is political ideology. At an individual level, numerous surveys (such as here, here and and here) have found that political ideology is the biggest predictor of climate science denial.
People who fear the solutions to climate change, such as increased regulation of industry, are more likely to deny that there is a problem in the first place – what psychologists call "motivated disbelief".
Consequently, groups promoting political ideology that opposes market regulation have been prolific sources of misinformation about climate change. This productivity has been enabled by the many millions of dollars flowing from the fossil fuel industry. Naomi Oreskes, co-author of Merchants of Doubt, refers to this partnership between vested interests and ideological groups as an "unholy alliance".
Reducing the influence
To reduce the influence of climate science denial, we need to understand it. This requires awareness of both the role of political ideology and the support that ideological groups have received from vested interests.
Without this understanding, it's possible to make potentially inaccurate accusations such as climate denial being purely motivated by money, or that it is intentionally deceptive. Psychological research tells us that ideologically driven confirmation bias (misinformation) is almost indistinguishable from intentional deception (disinformation).
Video from free online course Making Sense of Climate Science Denial (launches August 9).
The fossil fuel industry has played a hugely damaging role in promoting misinformation about climate change. But without the broader picture including the role of political ideology, one can build an incomplete picture of climate science denial, leading to potentially counterproductive responses.
Links