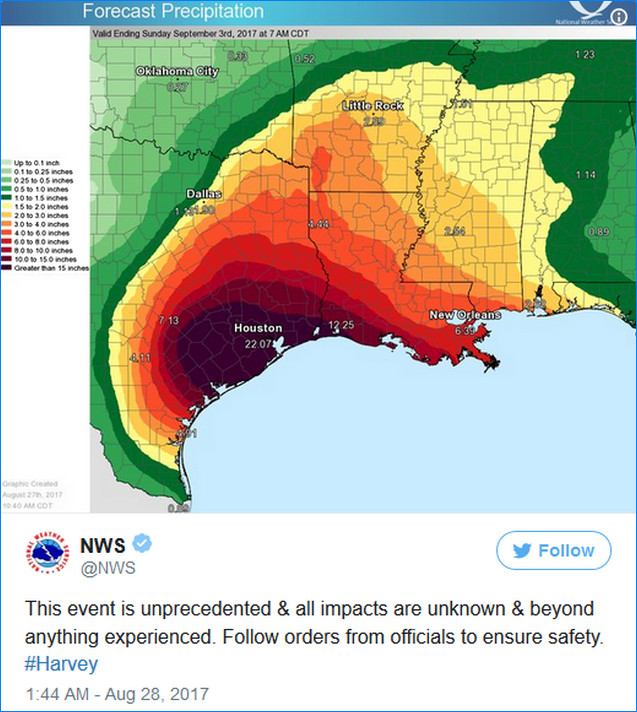
The United States Weather Service, normally not an agency prone to colourful language, issued an extraordinary statement on Sunday regarding hurricane Harvey, saying, "This event is unprecedented and all impacts are unknown beyond anything experienced".
It is now predicted the storm could eventually drop over 150 centimetres of rain in some areas, more than any other in the region's history.
Far from over, it is already clear that Harvey's impact is catastrophic. Six people are confirmed dead and that number is expected to increase. Cost estimates range up to $US100 billion.
America's efforts to combat climate change have been battered by President Donald Trump. Photo: AP
Meanwhile flooding in Bangladesh, India and Nepal during the region's worst monsoon season in a decade has killed an estimated 1200 people.
Climate scientists are reluctant to attribute any particular weather event to global warming, though in this case the signs are that human behaviour contributed to the formation and severity of the storm and its impact.
As tropical storm Harvey moved towards the Texas coast last week, few models predicted it would intensify into such a damaging weather system. It then hit an ocean patch in the Gulf of Mexico that remained so hot over the northern winter that it broke temperature records on one in four days according to Houston meteorologist Matt Lanza.
On the day Harvey hit, the area was around 2.2 degrees hotter than normal. Fuelled by the aberrant water temperature Harvey grew rapidly into a category-four cyclone as it hit the coast. It is now trapped in place over Houston, constantly siphoning energy and moisture from an ocean that scientists agree is likely to have been warmed by climate change.
The flooding across America's fourth-largest city was predicted last year in a joint investigation by the Texas Tribune and the non-profit investigative journalism organisation ProPublica.
"As millions have flocked to the metropolitan area in recent decades, local officials have largely rejected stricter building regulations, allowing developers to pave over acres of prairie land that once absorbed large amounts of rainwater. In the decade after Tropical Storm Allison [in 2001], about 167,000 acres were developed in Harris County, home to Houston," ProPublica wrote last week when it revisited its earlier investigation.
America's efforts to combat climate change and set policy to live with its impact have been battered by President Donald Trump, who formally notified the United Nations of his decision to withdraw from the Paris climate agreement earlier this month.
Last month Mr Trump rescinded Obama-era regulations that would have made urban development and infrastructure more flood resilient in future.
Mr Trump's Environmental Protection Agency director, Scott Pruitt, has made the dismantling of his agency's effort to combat climate change the central goal of his tenure, and in April the EPA scrapped its climate website entirely.
Australia risks following America's lead on climate change.
Efforts to craft national energy policy that reflect the realities of climate change and rapidly advancing renewable energy technology are blocked by a hardline faction of the coalition partyroom led by former prime minister, Tony Abbott.
In February last year CSIRO announced massive funding cuts to its climate change research division, only to partially overturn the decision in the face of sustained national and international criticism. This year the government ended all funding for the National Climate Change Adaptation Research Facility.
As with America's, Australia's ongoing failure to deal with climate change carries practical and moral consequence. We cannot significantly cut our greenhouse gas emissions without determined national effort and we cannot engage our diplomatic expertise and might to contribute more to an international solution until we cut our emissions.
We cannot any longer afford to tolerate the scientific myopia exemplified by Mr Trump and Mr Abbott.
Evacuees wade down a flooded section of Interstate 610 as floodwaters
from Tropical Storm Harvey rise in Houston on Sunday, Aug. 27, 2017.
Now is exactly the time to talk about climate change, and all
the other systemic injustices — from racial profiling to economic
austerity — that turn disasters like Harvey into human catastrophes.
Turn on the coverage of the Hurricane Harvey and the Houston flooding
and you’ll hear lots of talk about how unprecedented this kind of
rainfall is. How no one saw it coming, so no one could adequately
prepare.
What you will hear very little about is why these kind of
unprecedented, record-breaking weather events are happening with such
regularity that “record-breaking” has become a meteorological cliche. In
other words, you won’t hear much, if any, talk about climate change.
This, we are told, is out of a desire not to “politicize” a still
unfolding human tragedy, which is an understandable impulse. But here’s
the thing: every time we act as if an unprecedented weather event is
hitting us out of the blue, as some sort of Act of God that no one
foresaw, reporters are making a highly political decision. It’s a
decision to spare feelings and avoid controversy at the expense of
telling the truth, however difficult. Because the truth is that these
events have long been predicted by climate scientists. Warmer oceans
throw up more powerful storms. Higher sea levels mean those storms surge
into places they never reached before. Hotter weather leads to extremes
of precipitation: long dry periods interrupted by massive snow or rain
dumps, rather than the steadier predictable patterns most of us grew up
with.
The records being broken year after year — whether for drought, storm
surges, wildfires, or just heat — are happening because the planet is
markedly warmer than it has been since record-keeping began. Covering
events like Harvey while ignoring those facts, failing to provide a
platform to climate scientists who can make them plain, all while never
mentioning President Donald Trump’s decision to withdraw from the Paris
climate accords, fails in the most basic duty of journalism: to provide
important facts and relevant context. It leaves the public with the
false impression that these are disasters without root causes, which
also means that nothing could have been done to prevent them (and that
nothing can be done now to prevent them from getting much worse in the
future).
It’s also worth noting that the Harvey coverage has been highly
political since well before the storm made landfall. There has been
endless talk about whether Trump was taking the storm seriously enough,
endless speculation about whether this hurricane will be his “Katrina
moment” and a great deal of (fair) point-scoring about how many
Republicans voted against Sandy relief but have their hands out for
Texas now. That’s politics being made out of a disaster — it’s just the
kind of partisan politics that is fully inside the comfort zone of
conventional media, politics that conveniently skirts the reality that
placing the interests of fossil fuel companies ahead of the need for
decisive pollution control has been a deeply bipartisan affair.
In an ideal world, we’d all be able to put politics on hold until the
immediate emergency has passed. Then, when everyone was safe, we’d have
a long, thoughtful, informed public debate about the policy
implications of the crisis we had all just witnessed. What should it
mean for the kind of infrastructure we build? What should it mean for
the kind of energy we rely upon? (A question with jarring implications
for the dominant industry in the region being hit hardest: oil and gas).
And what does the hyper-vulnerability to the storm of the sick, poor, and elderly tell us about the kind of safety nets we need to weave, given the rocky future we have already locked in?
People rest while waiting to board a bus
headed for San Antonio at an evacuation center in Corpus Christi, Texas,
on Friday, Aug. 25, 2017. Photo: Nick Wagner/Austin American Statesman/AP
With thousands displaced from their homes, we might even discuss the
undeniable links between climate disruption and migration — from the Sahel
to Mexico — and use the opportunity to debate the need for an
immigration policy that starts from the premise that the U.S. shares a
great deal of responsibility for the key forces driving millions from
their homes.
But we don’t live in a world that allows for that kind of serious,
measured debate. We live in a world in which the governing powers have
shown themselves all too willing to exploit the diversion of a
large-scale crisis, and the very fact that so many are focused on
life-and-death emergencies, to ram through their most regressive
policies, policies that push us further along a road that is rightly
understood as a form of “climate apartheid.”
We saw it after Hurricane Katrina, when Republicans wasted no time
pushing for a fully privatized school system, weakening labor and tax
law, increasing oil and gas drilling and refining, and flinging the door
open to mercenary companies like Blackwater. Mike Pence
was a key architect of that highly cynical project — and we should
expect nothing less in Harvey’s wake, now that he and Trump are at the wheel.
We are already seeing Trump using the cover of Hurricane Harvey to
push through the hugely controversial pardoning of Joe Arpaio, as well
as the further militarization of U.S. police forces. These are particularly ominous moves in the context of news
that immigration checkpoints are continuing to operate wherever
highways are not flooded (a serious disincentive for migrants to
evacuate), as well as in the context of municipal officials
tough-talking about maximum penalties for any “looters” (it’s well worth remembering that after Katrina, several African-American residents of New Orleans were shot by police amid this kind of rhetoric.)
In short, the right will waste no time exploiting Harvey, and any
other disaster like it, to peddle ruinous false solutions, such as
militarized police, more oil and gas infrastructure, and privatized
services. Which means there is a moral imperative for informed, caring
people to name the real root causes behind this crisis — connecting the
dots between climate pollution, systemic racism, underfunding of social
services, and overfunding of police. We also need to seize the moment to
lay out intersectional solutions, ones that dramatically lower
emissions while battling all forms of inequality and injustice
(something we have tried to lay out at The Leap and which groups, such as the Climate Justice Alliance, have been advancing for a long time.)
And it has to happen right now – precisely when the enormous human
and economic costs of inaction are on full public display. If we fail,
if we hesitate out of some misguided idea of what is and is not
appropriate during a crisis, it leaves the door wide open for ruthless
actors to exploit this disaster for predictable and nefarious ends.
It’s also a hard truth that the window for having these debates is
vanishingly small. We won’t be having any kind of public policy debate
after this emergency subsides; the media will be back to obsessively
covering Trump’s tweets and other palace intrigues. So while it may feel
unseemly to be talking about root causes while people are still trapped
in their homes, this is realistically the only time there is
any sustained media interest whatsoever in talking about climate change.
It’s worth recalling that Trump’s decision to withdraw from the Paris
climate accord — an event that will reverberate globally for decades to
come — received roughly two days of decent coverage. Then it was back to
Russia round-the-clock.
A little more than a year ago, Fort McMurray, the town at the heart
of the Alberta boom in tar sands oil, nearly burned to the ground. For a
time, the world was transfixed by the images of vehicles lined up on a single highway, with flames closing in on either side. At the time, we were told
that it was insensitive and victim-blaming to talk about how climate
change was exacerbating wildfires like this one. Most taboo was making
any connection between our warming world and the industry that powers
Fort McMurray and employed the majority of the evacuees, which is a
particularly high-carbon form of oil. The time wasn’t right; it was a moment for sympathy, aid, and no hard questions.
But of course by the time it was deemed appropriate to raise those
issues, the media spotlight had long since moved on. And today, as
Alberta pushes for at least three new oil pipelines to accommodate its
plans to greatly increase tar sands production, that horrific fire and
the lessons it could have carried almost never come up.
There is a lesson in that for Houston. The window for providing
meaningful context and drawing important conclusions is short. We can’t
afford to blow it.
Talking honestly about what is fueling this era of serial disasters —
even while they’re playing out in real time — isn’t disrespectful to
the people on the front lines. In fact, it is the only way to truly
honor their losses, and our last hope for preventing a future littered
with countless more victims. Links
Across the US, towns and metropolises like mine are united to meet the Paris climate agreement’s targets and protect our residents and businesses
‘Chicago also created the largest bike-sharing program in North America.’
Photograph: ddp USA/Rex/Shutterstock
While the Trump administration is dropping the mantle of leadership on climate change, American cities from coast to coast are picking it up. From small towns to metropolises and from the coasts to the heartland, Republican and Democratic mayors are united in common cause to curb emissions, shrink our carbon footprints and fight for a greener future.
Rather than accepting the White House’s wrongheaded withdrawal from the Paris climate agreement, cities are redoubling our efforts
to meeting the landmark accords’ benchmarks. We not only have the power
to take action, but unlike Washington we have the will to get the job
done.
Just days after Donald Trump’s shortsighted decision, I signed an executive order
formalizing Chicago’s commitment to adopting the guidelines of the
Paris agreement and reducing greenhouse gas emissions by 26-28% by 2025
(compared with 2005 levels). Chicago has a head start in this effort. We already cut carbon emissions by 7% from 2010-15, while our economy expanded by 12%.
How did we do it?
First, in 2012 we closed Chicago’s last two remaining coal plants.
Second, we retrofitted over 54m sq ft of buildings to make them more energy efficient, earning Chicago first place in the nation
for green building adoption and the distinction as the only large
American city to be granted the US Environmental Protection Agency
energy tar partner of the year award.
Third, to encourage alternatives to driving, Chicago is in the middle
of an unprecedented $8.5bn modernization of our mass transit system. We
also created the largest bike-sharing program
in North America, adding 108 miles of new protected bike lanes and 47
miles of off-street public bike paths, earning Chicago the accolade of the best city in the country for cyclists from Bicycling Magazine.
Fourth, our Drive Clean Chicago initiative
has supported $37m in low and emission zero vehicles, the equivalent of
taking 1,700 cars off the road a year. We are now in the process of
procuring Chicago’s first fleet of electric buses, charging stations and
hybrid police vehicles.
These steps are just a downpayment on the work ahead to meet the
benchmarks of the Paris climate agreement. Looking over the horizon, by
2025 Chicago will be the largest city in the country where every public building is powered by 100% renewable energy. Outside our buildings, we are converting all of our city streetlights to LED by 2021.
American cities have the power and the will to take action
collectively and in our own communities. We control the levers of
planning, land use and development – and we can use these tools to turn
promises and commitments into results.
This fall, Chicago will host the first North American Climate Summit,
a new forum for leaders from across the US, Canada and Mexico to
exchange innovative ideas and strengthen coordination and collaboration
in our common fight for a sustainable future.
The summit will build on the strength of successful existing partnerships including the C40 Cities Climate Leadership Group as well as Climate Mayors, a bipartisan coalition of more than 300 municipal leaders from across the US. We are also proud to partner with America’s Pledge,
a coalition made up of 227 cities and counties, nine states and more
than 1,600 businesses committed to upholding the Paris climate
agreement.
In Chicago and cities across America, we are sending a clear signal:
we will not be deterred and we will not let the truth about climate
change be obscured. When the Trump Environmental Protection Agency took down information on climate science from their website, Chicago put it up on our city website. More than a dozen other American cities followed suit.
Something is wrong when a president will do anything to protect every Confederate statue
in every city and town, but not one thing to protect those cities and
towns from rising sea levels, severe storms and other climate change
impacts that threaten municipalities’ very existence.
We hope that Washington finds the courage to lead, but in the
meantime we are going to keep pushing forward by cutting emissions,
reducing our reliance on coal and adopting the Paris climate agreement locally. Our residents and businesses demand nothing less.
Yes, Houston, you do have a problem, and – as insensitive as it seems to bring it up just now – some of it is your own making.
Let's be clear upfront. I unreservedly wish that all of your millions of citizens get safely through Tropical Storm Harvey, and the biblical-scale deluge and floods that are forecast to swamp your city in coming days.
Harvey: Catastophic flooding continues Houston is facing worsening historic flooding in the coming days as Tropical Storm Harvey dumps rain on the city, swelling rivers to record levels.
But, as the self-styled "world capital of the oil and gas industry",
there's a connection between rising global greenhouse gas levels and the
extreme weather now being inflicted that some of your residents have
understood for decades and had a hand in.
Houston and its
surrounds are home to some 5000 energy-related firms, 17 of which are
counted among the Fortune 500 list of largest US companies.
The nearby Gulf Coast is also one of the biggest oil-refining centres
anywhere. Not for nothing, the local football team was named the
Houston Oilers before it up-rigged elsewhere to become the Tennessee
Titans.
One thing that hasn't changed for almost 200 years is
scientists' basic understanding humans could alter the chemistry of the
atmosphere. By releasing more carbon dioxide, methane (also known as
natural gas), and other greenhouse gases, the atmosphere would trap more
heat and alter our climate in the process.
The links between fossil fuels and climate change – clear to all but a
handful of (often industry-funded) scientists – were hardly promotional
talking points oil firms have been keen to trumpet.
In fact, as an important research paper by Harvard University researchers Geoffrey Supran and Naomi Oreskes
released last week showed, the largest of them – ExxonMobil –
deliberately told the public a story at odds with their own research.
Houston Police SWAT officer Daryl Hudeck carries Connie Pham and her
13-month-old son Aiden after rescuing them from their home. Photo: AP
By stoking doubts about the climate change consequences of burning
fossils, the behemoth misled voters for four decades, successfully
stymieing demands for action in the US and abroad, including in
Australia.
Although ExxonMobil is headquartered in another Texan
city, Dallas, it bases many operations in Houston. The company has
picked Houston to host a sprawling new campus north of the city that will reportedly house 8000 employees.
Hurricane Harvey as it crossed the Gulf coast on Saturday. Photo: NOAA
IMAGE
Climate connection
Those seeking to discourage debate about Harvey's climate boost will
argue there hasn't been a major (category three or stronger) hurricane
crossing the continental US coast in almost 12 years.
Houses were left inundated in Rockport, Texas, with heavy rain still falling in the region. Photo: Alex Scott
Scientists and climate models, though, argue a warming planet won't
necessarily equate to more frequent and more intense tropical cyclones
in all basins every year. Decadal patterns are what you need to watch.
The
western Pacific is one basin where scientists are increasingly
confident of a discernable trend that is not good news for the large
populations in China, Japan and the Philippines – among others – that
are exposed. One study last year found as much as a four-fold increase in the number of super typhoons.
A photo taken from the International Space Station shows Hurricane Harvey over Texas on Saturday. Photo: Jack Fischer/NASA via AP
Indeed, scientists are increasingly able to tease out a global warming signal in extreme weather events of many kinds.
These include a study last year that found the probability of an extreme rainfall event in the central US Gulf Coast had increased 1.4 times because of anthropogenic climate change.
A separate study in 2013 examined,
among others, the contribution of climate change to super storm Sandy,
which left a damage bill of $US60 billion ($75 billion) across the
north-eastern US in 2012.
"Our future scenarios of Sandy-level
return intervals are concerning, as they imply that events of less and
less severity (from less powerful storms) will produce similar impacts,"
the paper found. "Further aggravating, the frequency and intensity of
major storms/surges are likely to increase in a warming climate."
Impacts made worse
Andrew King, a climate extremes research fellow at the University of
Melbourne and the ARC Centre of Excellence for Climate System Science,
said the complexity of cyclones makes it difficult to attribute climate
change to events such as Hurricane Harvey.
"These are hard to simulate, extreme cyclones, on the grid scale of climate models," he says.
What
is clearer, though, is a warming atmosphere makes heavy rainfall events
more possible. Each degree increase allows the atmosphere to hold
roughly 7 per cent more moisture.
Similarly, rising sea levels
means any storm surge accompanying a cyclone will be worse. "Even a
small increase in sea levels creates a big increase of the extent of a
storm surge going inland," King said.
Sea levels are rising globally – at about 3.4 millimetres a year – as glaciers and land-based ice sheets melt, and warming oceans expand.
Michael Mann, a prominent US climate scientist based at Pennsylvania State University, noted in a Facebook post how unusually warm Gulf waters, provided the energy for Harvey's near-record rate of intensification as it neared the coast.
Mann
also points to the unusually stationary nature of the hurricane, which
is leading to a "seemingly endless deluge" that could dump as much as
1.3 metres of rainfall before it's done.
IMAGE
"This pattern, in turn, is associated with a greatly expanded
subtropical high pressure system over much of the US right now, with the
jet stream pushed well to the north," Mann says. "This pattern of
subtropical expansion is predicted in model simulations of human-caused
climate change."
When the clean-up eventually begins in Houston
and other regions battered and drenched in this week's tempest,
questions about what protection will be needed for the next big storm
will no doubt surface.
Given its unusual dependence on fossil-fuel
industries, though, it will be interesting to watch if Houston queries –
tactfully and delicately – its own contribution to the catastrophe.
We can’t say that Hurricane Harvey was caused by climate change. But it was certainly worsened by it
A family evacuate their home after flooding from Hurricane Harvey, Houston, Texas, 27 August.
Photograph: Joe Raedle/Getty Images
What can we say about the role of climate change in the unprecedented disaster that is unfolding in Houston with Hurricane Harvey? There are certain climate change-related factors that we can, with great confidence, say worsened the flooding.
Sea level rise attributable to climate change – some of which is due
to coastal subsidence caused by human disturbance such as oil drilling –
is more than half a foot (15cm) over the past few decades (see here
for a decent discussion). That means the storm surge was half a foot
higher than it would have been just decades ago, meaning far more
flooding and destruction.
In addition to that, sea surface temperatures in the region have
risen about 0.5C (close to 1F) over the past few decades from roughly
30C (86F) to 30.5C (87F), which contributed to the very warm sea surface
temperatures (30.5-31C, or 87-88F).
There is a simple thermodynamic relationship known as the Clausius-Clapeyron equation
that tells us there is a roughly 3% increase in average atmospheric
moisture content for each 0.5C of warming. Sea surface temperatures in
the area where Harvey intensified were 0.5-1C warmer than current-day
average temperatures, which translates to 1-1.5C warmer than “average”
temperatures a few decades ago. That means 3-5% more moisture in the
atmosphere.
That large amount of moisture creates the potential for much greater
rainfalls and greater flooding. The combination of coastal flooding and
heavy rainfall is responsible for the devastating flooding that Houston is experiencing.
Not only are the surface waters of the Gulf of Mexico unusually warm
right now, but there is a deep layer of warm water that Harvey was able
to feed upon when it intensified at near record pace as it neared the
coast. Human-caused warming is penetrating down into the ocean. It’s
creating deeper layers of warm water in the Gulf and elsewhere.
Sea surface temperatures in the region have risen about 0.5C (close to 1F) over the past few decades
Harvey was almost certainly more intense than it would have been in
the absence of human-caused warming, which means stronger winds, more
wind damage and a larger storm surge. (As an example of how this works,
we have shown
that climate change has led to a dramatic increase in storm surge risk
in New York City, making devastating events like Hurricane Sandy more likely.)
Finally, the more tenuous but potentially relevant climate factors:
part of what has made Harvey such a devastating storm is the way it has
stalled near the coast. It continues to pummel Houston and surrounding
regions with a seemingly endless deluge, which will likely top out at
nearly 4ft (1.22m) of rainfall over a days-long period before it is
done.
The stalling is due to very weak prevailing winds, which are failing to
steer the storm off to sea, allowing it to spin around and wobble back
and forth. This pattern, in turn, is associated with a greatly expanded
subtropical high pressure system over much of the US at the moment, with
the jet stream pushed well to the north. This pattern of subtropical
expansion is predicted in model simulations of human-caused climate
change.
More tenuous, but possibly relevant still, is the fact that very
persistent, nearly “stationary” summer weather patterns of this sort,
where weather anomalies (both high-pressure dry hot regions and
low-pressure stormy/rainy regions) stay locked in place for many days at
a time, appears to be favoured by human-caused climate change. We
recently published a paper in the academic journal Nature on this phenomenon.
In conclusion, while we cannot say climate change “caused” Hurricane
Harvey (that is an ill-posed question), we can say is that it
exacerbated several characteristics of the storm in a way that greatly
increased the risk of damage and loss of life. Climate change worsened
the impact of Hurricane Harvey. *Michael E Mann is distinguished professor of atmospheric science at Pennsylvania State University, director of the Penn State Earth System Science Center and author of three books, including The Hockey Stick and The Climate Wars, Dire Predictions, and The Madhouse Effect.
Houston’s Interstate Highway 45 was totally submerged in the deluge.
REUTERS/Richard Carson
Over the past week we have seen two major tropical storms devastate
different parts of the world. First Typhoon Hato struck Hong Kong and
Southern China killing at least a dozen people.
And over the weekend Hurricane Harvey made landfall from the Gulf of
Mexico, bringing extremely heavy rain to southern Texas and causing devastating floods in Houston.
IMAGE
Tropical cyclones are, of course, a natural feature of our climate.
But the extreme impacts of these recent storms, especially in Houston,
has understandably led to questions over whether climate change is to
blame.
How are tropical cyclones changing?
Tropical cyclones, called typhoons in the Northwest Pacific and
hurricanes in the North Atlantic, are major storm systems that initiate
near the Equator and can hit locations in the tropics and subtropics
around the world.
When we look at the Atlantic Basin we see increases in tropical storm
numbers over the past century, although there is high year-to-year
variability. The year 2005, when Hurricane Katrina devastated New
Orleans, marks the high point.
There is a trend towards more tropical storms and hurricanes in the North Atlantic.US National Hurricane Center LARGE IMAGE
We can be confident that we’re seeing more severe tropical cyclones
in the North Atlantic than we did a few decades ago. It is likely that
climate change has contributed to this trend, although there is low
statistical confidence associated with this statement. What that means
is that this observed increase in hurricane frequency is more likely
than not linked with climate change, but the increase may also be linked
to decadal variability.
Has Harvey been enhanced by climate change?
Unlike other types of extreme weather such as heatwaves,
the influence of climate change on tropical cyclones is hard to pin
down. This is because tropical cyclones form as a result of many factors coming together, including high sea surface temperatures, and weak changes in wind strength through the depth of the atmosphere.
These storms are also difficult to simulate using climate models. To
study changes in tropical cyclones we need to run our models at high
resolution and with interactions between the atmosphere and the ocean
being represented.
It’s much easier to study heat extremes, because we can do this by
looking at a single, continuous variable: temperature. Tropical
cyclones, on the other hand, are not a continuous variable; they either
form or they don’t. This makes them much harder to model and study.
Tropical cyclones also have many different characteristics that might
change in unpredictable ways as they develop, including their track,
their overall size, and their strength. Different aspects of the
cyclones are likely to change in different ways, and no two cyclones are
the same. Compare that with a heatwave, which often have similar
spatial features.
For all these reasons, it is very hard to say exactly how climate change has affected Hurricane Harvey.
So what can we say?
While it’s hard to pin the blame for Hurricane Harvey directly on
climate change, we can say this: human-caused climate change has
enhanced some of the impacts of the storm.
Fortunately, in Harvey’s case, the storm surge hasn’t been too bad,
unlike for Hurricanes Katrina and Sandy, for example. This is because Harvey did not travel as far, and weakened rapidly when it made landfall.
We know that storm surges due to tropical cyclones have been enhanced by climate change. This is because the background sea level has increased, making it more likely that storm surges will inundate larger unprotected coastal regions.
Building levees and sea walls can alleviate some of these impacts,
although these barriers will need to be higher (and therefore more
expensive) in the future to keep out the rising seas.
Rockport, Texas, was one of the coastal towns flooded by Hurricane Harvey.EPA/Darren Abate
Deluge danger
Harvey’s biggest effect is through its intense and prolonged
rainfall. A low pressure system to the north is keeping Harvey over
southern Texas, resulting in greater rainfall totals.
IMAGE
The rainfall totals are already remarkable and are only going to get worse.
We know that climate change is enhancing extreme rainfall. As the
atmosphere is getting warmer it can hold more moisture (roughly 7% more for every 1℃ rise in temperature).
This means that when we get the right circumstances for very extreme
rainfall to occur, climate change is likely to make these events even
worse than they would have been otherwise. Without a full analysis it is
hard to put exact numbers on this effect, but on a basic level, wetter
skies mean more intense rain.
Houston, we have a problem
There are other factors that are making this storm worse than others in terms of its impact. Houston is the second-fastest growing city in the US, and the fourth most populous overall.
IMAGE
As the region’s population grows, more and more of southern Texas is
being paved with impermeable surfaces. This means that when there is
extreme rainfall the water takes longer to drain away, prolonging and
intensifying the floods.
Hurricane Harvey is likely to end up being one of the most costly
disasters in US history. It is also likely that climate change and
population growth in the region have worsened the effects of this major
storm.
Australia produced enough renewable energy to power 70 per cent of
households last financial year, new data shows, but advocates warn the
booming industry will flounder unless the Turnbull government commits to
a clean energy target.
The government is sharply divided over
whether to adopt the target, the central recommendation of Chief
Scientist Alan Finkel's review of the national electricity market.
Sunverge chief executive Ken Munson said Australia's high penetration of
rooftop solar, where one in five homes use power from the sun, put the
country at the forefront of the transforming energy industry.
New data to be released on Monday shows Australia produced enough
renewable energy to power 7.1 million homes, or 70 per cent of
households, in the year to June.
This avoided carbon pollution
equal to removing 8.1 million cars from the road for a year – more than
half the cars in Australia.
Minister for Environment Josh Frydenberg. Photo: Alex Ellinghausen
The data, known as the Renewable Energy Index, was produced by analysts Green Energy Markets and funded by advocacy group GetUp!
It shows renewables comprised 17.2 per cent of electricity generated in Australia's east and west coast main grids last financial year, up from 7 per cent a decade ago.
Green Energy Markets director of analysis and advisory, Tristan Edis, said the industry had recovered from an "investment drought" under former prime minister Tony Abbott, whose government cut the renewable energy target.
Mr Edis said investors had recovered confidence under Prime Minister Malcolm Turnbull but the boom "could soon turn to bust" unless the government adopts a clean energy target, which would provide investment certainty beyond 2020 when the renewable energy target peaks.
Australia produced enough renewable energy to power 70 per cent of households last financial year, new data shows. Photo: Jessica Shapiro
The index showed at the end of June this year, 46 large-scale
renewable energy projects were being built. They are expected to create
enough construction jobs to employ 8868 people fulltime for a year.
Almost
150,000 small-scale rooftop solar systems were installed during the
year to June, which will deliver about $1.6 billion in power bill
savings over the next decade, or almost $10,000 per system.
Environment Minister Josh Frydenberg said Australia's energy market was in transition "as we move to a lower-emissions future".
"It
is not about stopping the transition or renewables versus fossil fuels,
it's about managing the transition to ensure affordable and reliable
energy supply," he said.
Mr Frydenberg cited Clean Energy Council
figures showing there was a record $8 billion of renewable investment
underway, delivering more than 4000MW of new renewable generation
capacity.
He has previously said the clean energy target, if
implemented, would not come into effect until 2020 so there was "no
rush" for the government to make a decision.
GetUp! environmental
justice campaign director Miriam Lyons said the new data showed the
renewable energy industry was now a "major player".
"It reveals a
dramatic shift in public sentiment towards green energy ... [and that]
public support for renewables has been resilient in the face of so many
political attacks," she said.
The index, to be updated monthly,
will track the renewable energy Australia produces, jobs created,
pollution reduced and savings on power bills from rooftop solar.
The unexpected boom in China’s solar PV installation this year may have
an unfortunate impact on the ambitious plans of many in Australia’s
surging solar sector – a bottleneck in module supplies and price rises
by the end of the year.
Source: Flickr
The supply crunch has been predicted by market analyst IHS, as part
of its forecast for a record 90GW of solar PV to be installed across the
world in 2017, with 45GW of this to be installed in China alone.
The size of China’s installations – nearly equivalent to the size of
Australia’s entire grid capacity – has taken analysts by surprise,
because it was generally assumed that the strong first half installation
was due to the expiry of a generous geed-in tariff on July 1.
But the installation rates have continued unabated, with 11.3GW
installed in July alone, and IHS says the China demand is consuming a
large proportion of the global PV module supply, leading to increased
prices and lead times that extend into 2018.
“The latest installation forecast implies that the PV module supply
chain is at the very upper end of what it can produce within a year. In
reality, the final number of module shipments for 2017 is likely to be
limited by the supply of polysilicon.
“As a result of the tight supply, projects are being delayed” and as a
result IHS Markit has cut its forecast for installations outside of
China in 2017 by 7GW.
Australia, which is experiencing a boom in large-scale solar projects, and in rooftop solar, is also expected to be affected.
“This high China demand has a great impact on pricing and
availability in markets sourcing modules from China, such as Australia,”
says IHS analyst Josefin Berg.
“Many of the large PV projects secured modules earlier in the year,
and may not be impacted. But we do expect some of the large projects
that initially were planned for 2017 completion to be pushed into 2018.”
Solar farm developers and contractors confirmed to RenewEconomy that
the supply crunch was starting to have an impact. “Absolutely, there is
high demand for modules at the moment,” said one. “There is a global
shortage, pricing has gone up the past 6 weeks,” said on wholesaler.
According to Reneweconomy’s data, there are more than 2,300MW of
large-scale solar plants either under construction or about to build
across Australia, and another 12GW of projects in the pipeline –
although it seems clear that not all these will be built.
Most solar projects are effectively being built without subsidy,
because the off-takers are generally taking the renewable energy
certificates that will be generated by the plant.
Only those companies with deep enough pockets to fund the equity
component are able to take the “merchant risk” and sell into the
wholesale market and benefit from the current high price of LGCs.
However, few of these plants are actually under construction.
The competitive nature of the contract market is being exacerbated by
the fact that the big retailers are close to filling their legislated
mandates, and the corporate PPA market is only just emerging. This is
keeping margins fine, and a rise in module prices – even as little as 10
per cent – could have an impact on returns and pricing.
Global module pricing is also being affected by the Suniva trade case
in the US, where a tariff on Chinese module imports is being
considered.
Solar module prices have rebounded to the mid US40c/watt, a 25 to 30
per cent increase over prices just a few months earlier, which Deutsche
Bank says is driven also by stronger global demand, lack of supply chain
inventory and supply shut-downs at some Chinese companies that
are transitioning standard lines into higher efficiency lines.
“Although China demand is likely to slow down in (the second half),
demand is not falling off a cliff and the recently introduced China
target suggests that China demand would remain relatively stable in 2018
timeframe while demand in rest of the world continues to grow,” it said
in an analysis two weeks ago.
“Across the supply chain, poly, wafer and Taiwanese cell prices have
also started increasing over the past few months, reflecting the overall
tightness in solar supply chain.”
As an example of how price variations can affect project pipelines,
Deutsche says that a tariff of 10c/watt could impact 80 per cent of the
pipeline of large-scale solar projects in the US.
In Australia, however, that impact may not be so great because solar
is competing against soaring wholesale prices and huge retail prices,
meaning that the savings for business consumers in particular remain
substantial, once management turns their mind to it.
In recent months, Australian major energy users, like Sun Metals, Telstra,
the Whyalla steel plant, Nectar Farms, and numerous smaller businesses
are also investing heavily in wind and solar and storage, some up to the
level of 100 per cent.
Four of the world’s biggest companies – Apple, Amazon, Google and
Facebook, have vowed to source all their electricity needs from
renewable energy within a few years, and they have also been joined by
the likes of IKEA and brewing giant In-Bev, the owner of Foster’s.
Apple and Foster’s have yet to announce their plans to make their
Australian operations 100 per cent renewables, but PPAs for solar plants
are expected to feature high in their strategy.
In an earlier report, Deutsche Bank said that the global average
unsubsidised levelized cost of delivered solar would be cheaper than
coal in more than 50 markets by 2022.
This would represent 5,000GW of available market potential,
underlining a point made earlier this week by UNSW solar pioneer Martin
Green, who expects prices to fall to $US10/MWh
in some parts of the world, with prices in the mid $US20/MWh to be
standard elsewhere, pushing the world towards annual installation
targets of 1,000GW by the mid 202s, compared to just under 100GW now.
Solar panels are still a rarity in WA’s lower-income areas.
Orderinchaos/Wikimedia Commons, CC BY-SA
Many Western Australian householders are living in “energy poverty”,
according to our new Bankwest Curtin Economics Centre research report, Power to the People: WA’s Energy Future.
Although average household spending on electricity, gas and heating
is no more than 4% of income, the figure rises considerably for those on
lower incomes. In particular, more than a quarter of single-parent
families say they spend more than 10% of their income on energy.
Single parents in particular are far more exposed to energy poverty, a
trend that has grown over the past 10 years. Around one in ten of these
households spends at least 15% of their income on energy costs. In some
cases, this forces them to compromise on other essentials such as food
and health care.
Rising energy costs, as well as a personal commitment to reducing
greenhouse gases, are motivating many WA households to vote with their
feet (or wallets) and adopt rooftop solar photovoltaic (PV) panels at a
dramatic rate.
In WA, the installed capacity of rooftop solar PV has grown by 37% in
the past 18 months alone. Around 25% of suitable dwellings are now
fitted with solar panels. This takes WA to third place among Australian
states, behind Queensland (32%) and South Australia (31%).
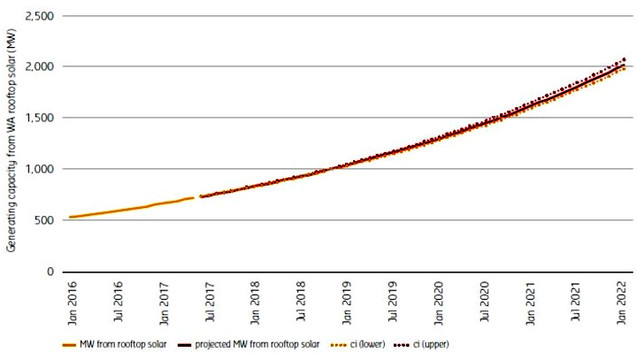
If this trend continues, the state’s rooftop solar PV capacity is
predicted to exceed 2,000 megawatts by 2022. That’s larger than all but
one of WA’s power stations.
Generating capacity from WA rooftop solar, 2016 to 2022
Projections are based on predictions
from a log linear regression of total MW of rooftop solar PV capacity,
and reflect the growth both in the number of installations and the
average MW output per solar PV installation.Bankwest Curtin Economics Centre/Clean Energy Regulator
Similar trends are predicted at a national level, with consumer-bought rooftop solar PV expected to account for around 24% of electricity generation by 2040.
This is set to make Australia one of the most decentralised electricity
networks in the world, with 45% of its total generating capacity coming
from “behind the meter”.
Haves and have-nots
Rooftop solar is a popular option, but not all households are able to
take advantage of this technology. Our report reveals a clear
socioeconomic gradient in household solar installations in WA.
Panels are fitted to only 7.4% of suitable homes in areas in the
lowest 10% on socioeconomic indicators. That figure rises to 16% in the
next-lowest 10%, and the gap widens still further as income rises. Solar
installation rates are around 30% in mid-to-high socioeconomic areas.
Share of suitable WA homes with solar panels, by level of socioeconomic disadvantage
Homes deemed suitable for solar PV
include detached, semi-detached or terraced houses, but not
strata-titled apartments or units.Bankwest Curtin Economics Centre/Clean Energy Regulator/ABS
Better incentives could boost these numbers,
especially in poorer areas. The initial upfront costs deter many
homeowners, while most landlords have little financial motivation to
install solar on rental properties.
Accessible, secure and affordable energy is essential to any
well-functioning economy. And many citizens, communities and
governments are acting on the imperative to move to a greener source.
Despite its huge amounts of wind and sunshine, WA lags behind other
states both in committing to a clear renewable energy target and in its
investment in large-scale renewable power projects.
Renewable projects under construction or at commissioning stage in 2017
Projects at the commissioning phase
at the end of 2016 are not included in the total new capacity figure.
Investment in the South Australia Hornsdale Wind Farm includes stages 1,
2 and 3. Data for ACT and NT not available; ACT is expected to draw
most of its renewable energy from other states and territories.Bankwest Curtin Economics Centre/Clean Energy Council Australia/various other sources
According to our report, WA’s total greenhouse gas emissions in 2015
were 86.5 million tonnes of carbon dioxide equivalent – fourth-ranked
behind Queensland, New South Wales and Victoria. This means WA
contributed 16.1% of Australia’s national emissions that year.
But while other states and territories have adopted proactive
emissions-reduction policies such as state-based renewable energy
targets, WA has not yet taken substantial action on this front.
Here’s the likely game-changer: efficient, cost-effective battery storage that can deliver power at the scale required. Storage is set to become vital, both for smoothing out domestic power consumption from solar panels and for large-scale electricity generation. The Finkel Review
has recommended that all future renewable energy projects be required
to produce “dispatchable” power – that is, be able to store their power
and release it at times of higher demand.
Greater efficiency in balancing energy demand over the course of the
day, and across large-scale grid systems that feature a range of
different weather conditions, is also likely to help overcome the
intermittency problems associated with renewable sources.
Australia is on the cusp of an energy revolution, and the pace of
change is only going to increase. WA, like every state, needs a clear
roadmap to navigate the journey effectively, one that integrates
existing and emerging energy technologies and maintains protections for
families who cannot currently afford solar panels.
This will give greater certainty to the energy future we can all expect – and, critically, ensure that no one is left behind.
Changes in sea level height from 1993 to 2017 compared with a
long-term mean of the data. Blue and purple are lower than the mean;
red, yellow and white are higher. Image credit: NASA/JPL-Caltech.
August 10 marked the 25th anniversary of the launch of a
revolutionary ocean research vessel — a space "ship." As the NASA/CNES
Topex-Poseidon satellite ascended into orbit, it ushered in a new era of
oceanography with the first highly accurate, global measurements of sea
levels. That mission and its three successors, all named Jason, have
continuously mapped global ocean currents and tides; opened our eyes to
the global reach of El Niño and other climate events; created a
quarter-century-long, extraordinarily precise record of global and
regional sea level rise; and enabled improved forecasts of extreme
weather events such as hurricanes, floods and droughts.
A new slideshow celebrates this important data set — a fundamental
measurement for the study of the oceans and climate — and the
longstanding U.S.-French collaboration that brought it about.
In 1992, when Topex-Poseidon launched, no one foresaw that its record
of precision ocean height measurements would continue through three
decades and four spacecraft. In fact, many oceanographers at the time
weren't convinced that Topex-Poseidon's sensors would be accurate enough
to reveal the signal of sea level rise out of the noise of waves, tides
and other changes. But the radar altimeter and radiometer measurement
system outperformed expectations from the start. In 25 years of
continuous operation, Topex-Poseidon and its successors have recorded
2.8 inches (7 centimeters) of global average sea level rise.
Our planet’s oceans are too vast and complex to be fully measured by
any single satellite, or even by any single nation. Topex-Poseidon and
its successor Jason satellite missions are shining examples of the power
of a sustained, long-term international partnership, led by the U.S.
and French space agencies, NASA and CNES. For nearly three decades,
NASA and CNES scientists and engineers have pooled their expertise,
talents and insights to design and construct an integrated spaceborne
measurement system far more powerful than the sum of its parts. NASA and
CNES have worked together, applying advanced technology to collect
measurements of remarkable precision and accuracy, and then making those
measurements freely and openly available. With this effort, they have
provided humanity with unprecedented views of the global oceans, how
they change on time scales of days to decades, and how the oceans
influence — and respond to — weather and climate.
“For more than a generation, NASA and CNES scientists and engineers
have collaborated to make exquisitely accurate measurements of the ocean
surface from space, providing insights into the workings and
interactions of our planet’s two great fluid systems, the oceans and the
atmosphere,” said Michael Freilich, director of NASA’s Earth Science
Division in Washington.
Ocean currents
This is an animation of ocean surface currents from June 2005 to
December 2007 from NASA satellites. Watch how bigger currents like the
Gulf Stream in the Atlantic Ocean and the Kuroshio in the Pacific carry
warm waters across thousands of miles at speeds greater than four miles
per hour (six kilometers per hour); how coastal currents like the
Agulhas in the Southern Hemisphere move equatorial waters toward Earth's
poles; and how thousands of other ocean currents are confined to
particular regions and form slow-moving, circular pools called eddies.
Credit: NASA/SVS. Download video.
The Topex-Poseidon mission was the first to monitor the changing
patterns of major ocean surface currents in a comprehensive way. Ocean
current locations are revealed by large-scale hills and valleys on the
ocean surface, which can vary by more than 6 feet (2 meters) in height.
The peaks and dips defining the ocean’s topography are caused by
variations in water temperature and pressure. Large-scale currents like
the Gulf Stream tend to flow along contours of constant ocean height,
following the sides of the hills and valleys. The steepness of a slope
indicates the speed of the current. Unlike terrain on land, however, the
liquid "landscape" shifts with changes in winds, temperature and other
factors, causing shifts in the locations and speeds of the currents. The
only way to monitor these changes over the entire surface of Earth's
ocean is to make precise measurements of the height of the ocean surface
from orbiting satellites.
Measuring the ocean shape over nearly the entire globe every 10 days,
Topex-Poseidon gave the first quantitative view of how ocean currents
change with the seasons. Topex/Poseidon and the Jason-1, Jason-2 and
Jason-3 missions have provided unique insights into how ocean
circulation affects climate by moving heat from place to place on our
planet.
Heat storage in the ocean
NOAA's annual assessment of the heat in the upper ocean (2015 shown), a
measure of global warming, draws on Topex series data. Image credit:
NOAA.
More than 90 percent of the heat from global warming is stored in the
ocean, which means oceans are key players in global climate. Heat
causes ocean water to expand, adding to sea level rise. Measuring both
long-term sea level trends and the shape of the ocean surface related to
currents, Topex-Poseidon and the Jason series provide two basic
ingredients for understanding the ocean's role in global climate
variations.
"As human-caused global warming drives sea levels higher and higher,
we are literally contributing to the reshaping of the surface of our
planet," said Josh Willis, NASA project scientist for Jason-3 at NASA's
Jet Propulsion Laboratory in Pasadena, California. "The precision
altimetric satellite missions tell us how much and how fast."
El Niño, La Niña, and more
Among Topex-Poseidon's early achievements was recording the full extent
of a record El Niño in 1997 and the succeeding La Niña in 1999. Darker
colors are sea levels lower than normal, lighter and white colors are
higher than normal. Image credit: NASA/JPL-Caltech.
For decades, scientists could not predict how El Niño and other
year-to-year ocean variations changed regional weather. That was partly
because, using only ships and buoys, they couldn't observe the genesis
and growth of these changes far out in the equatorial Pacific.
Topex-Poseidon and the Jason satellites have given the first frequent,
global views of the full extent and life cycles of El Niño and La Niña
events. Lee-Lueng Fu of JPL — project scientist for the first two ocean
altimetry missions — pointed out, "Topex-Poseidon allowed us to follow
their evolution and showed that these events weren't limited to just the
tropics. It also gave us evidence of even longer-lasting ocean
variations." One of these is the Pacific Decadal Oscillation, similar to
El Niño and La Niña in character but with phases lasting up to several
decades.
In the last 25 years, with the help of altimetry data, scientists
have pinpointed many global connections between these multi-year ocean
variations and weather consequences such as drought and flooding
throughout the globe. While these events have by no means yielded all
their secrets, they are better understood and better forecast than
before global spaceborne observations began.
Tides on the open ocean
A numerical model of daily global tides using sea level data from Topex-Poseidon. Image credit: ESR.
Before satellite measurements, deep-ocean tide measurements were
difficult to make, expensive and sparse. Topex-Poseidon made the first
global maps of tides, which changed scientists' understanding of how
tides dissipate. The data show that a third of tidal energy dissipates
in the open ocean, playing important and previously unknown roles in
mixing water within the ocean.
Jason-1
Topex-Poseidon had a three-year prime mission, but long before that
time was up, oceanographers and other Earth scientists recognized the
value of continuing its measurements as long as possible. Fu explained,
"Sea surface height is a fundamental measure of the Earth system, so it
was a no-brainer that scientists would want to have this kind of
information indefinitely." With strong community support, Jason-1 was
constructed by NASA and CNES and launched in December 2001. For three
years, Topex-Poseidon and Jason-1 flew in coordinated orbits that
allowed scientists to cross-calibrate their measurements and then
combine the data sets to observe the global oceans more frequently. Each
succeeding mission has also overlapped its predecessor, ensuring a
consistent data record.
So far, each of the ocean altimetry missions has proven to be
long-lived. Topex-Poseidon was eventually decommissioned in 2005 after
13 years in orbit. Jason-1 survived almost 12 years, until July 2013.
Nine-year-old Jason-2 and Jason-3 (launched in January 2016) are still
in operation.
Jason-2
Lee Fu (left) was the project scientist for Topex Poseidon and Jason-1
and -2. Josh Willis is the current project scientist for Jason-2 and -3.
Image credit: NASA/JPL-Caltech.
With the launch of Jason-2 in June 2008, the focus of spaceborne
ocean altimetry transitioned from research objectives to data
applications providing tangible benefits to society. Mission operations
moved from the research agencies NASA and CNES to the U.S. National
Oceanic and Atmospheric Administration (NOAA) and the European
Organisation for the Exploitation of Meteorological Satellites
(EUMETSAT); indeed, satellite altimeter measurements are used routinely
in NOAA’s El Niño forecasts. NASA and CNES continue to provide science
teams, instrument design, and science-focused, specialized data
management.
Forecasting
Jason-1 data contributed to this forecast of Hurricane Rita's track
across the Gulf of Mexico in 2005. The storm track appears as a black
line. Jason-1 observed a tongue of very warm water (red) in the gulf,
13-23 inches (35-60 centimeters) higher than surrounding water. Ocean
heat can strengthen hurricane intensity. Image credit:
NASA/JPL-Caltech/University of Colorado.
On smaller space and time scales, satellite altimetry measurements
provide information directly useful for marine storm prediction.
Hurricanes are fueled by heat stored in the ocean below, and since the
upper ocean expands and contracts as it heats and cools, sea level
height is a marker for water temperature and heat content. So it is
hardly surprising that ocean altimetry data are routinely used in
forecasting hurricane strength.
In 2014, an unexpected forecasting use for altimetry data became
operational. Bangladesh, whose 46-year history has encompassed
death-dealing river floods, uses Jason-2 measurements of river levels in
its flood forecasting and warning system. Within the first year using
these data, Bangladesh's system enabled the most accurate, long-lead
flood warnings ever given for that nation.
Navigation
The U.S. Navy uses the ocean altimetry satellites' data to aid surface and underwater navigation. Image credit: U.S. Navy.
Civilian sailors and the U.S. Navy use the series' near-real-time
data on currents, eddies, winds and waves to aid surface and underwater
navigation. Information on eddy currents in the Gulf of Mexico has been
used by marine operators to schedule offshore drilling operations, with
significant cost savings.
Jason-3
Artist's rendering of Jason-3. Image credit: NASA/JPL-Caltech.
When Jason-3 launched in 2016, NASA project scientist Willis
commented, "This mission has big shoes to fill. Its predecessors have
built one of the clearest records we have of our changing climate."
Jason-3 has performed flawlessly in continuing the global record of
precise sea-surface topography measurements and is now halfway through
its prime mission.
A new role for Jason-2
Jason-2's new, lower orbit will allow scientists — such as Walter H. Smith
(NOAA) and David Sandwell (Scripps Institution of Oceanography), who
produced this map — to improve their understanding of features on the
global seafloor. Image credit: NOAA.
This year, Jason-2's onboard systems began to show signs of space
radiation damage. The mission management decided to lower the satellite
out of its shared orbit with Jason-3. At the urging of the science
community, the satellite was lowered by 17 miles (27 kilometers), where
it will collect data along a series of ground tracks only 5 miles (8
kilometers) apart, with a one-year repeat cycle.
Besides protecting Jason-3, the new orbit will allow Jason-2 to
produce an improved, high-resolution estimate of Earth's average sea
surface height. Because ocean topography is partly determined by the
contours on the ocean bottom, the estimate is expected to enable
scientists to improve maps of the seafloor, resolving currently unknown
details of underwater features such as seamounts. These maps will permit
advances in ocean modeling, tsunami wave forecasting and naval
operations support.
Into the future
Illustration of the upcoming Sentinel-6 mission. Image credit: ESA.
The next ocean altimetry mission, expected to launch in 2020, is
called Jason Continuity of Service (Jason-CS) on the Sentinel-6 mission.
As the long name implies, it will carry on the proud Jason legacy, but
with a new partner: the European Space Agency. EUMETSAT will lead the
mission, and NASA's role will remain similar to its role in Jason-3.
CNES will assess and evaluate the performance of the mission and provide
precise orbit determination.
Satellites have already revolutionized oceanography, and soon they
will do the same for hydrology -- the study of water on land. The
French/U.S. Surface Water and Ocean Topography (SWOT) mission will be at
the forefront, carrying an innovative interferometer dubbed KaRin that
marks a break with today's technologies.
Fu notes that these changes show the value the world scientific
community places on the ocean altimetry program. "The measurement is so
important, and the technology is fully demonstrated," he said. "In the
long haul, ocean altimetry is an international commitment."


