The decision by the independent pricing regulator to slash payments
for households exporting surplus solar power from their rooftop panels
will "sabotage" the industry, critics warn.
The Independent Pricing and Regulatory Tribunal (IPART) released its final report on solar feed-in tariffs on Tuesday,
recommending the voluntary payments be cut from 11¢-15¢ per
kilowatt-hour by about half from the start of this month to 6.9¢-8.4¢.
Less for more: Solar installations are running at record levels but feed-in tariffs are to be cut in NSW. Photo: Justin McManus
"Our
view is that households without solar panels should not have to pay
higher retail prices to reduce the bills of customers with solar
panels," IPART said in justifying its cut. "This would
disadvantage the households who are unable to install a solar system themselves."
It
noted a household with a 2-kilowatt photovoltaic system was already
paying about $1550 a year for power, $550 less than those without
panels.
Environment Minister Gabrielle Upton said IPART’s
recommended benchmark was "an important signal to ensure consumers are
getting a fair price for their energy without penalising consumers that
can’t access rooftop solar including renters and apartment dwellers".
"The cost of installing rooftop solar continues to fall and we expect to see strong take-up continue in NSW," she said.
But
Labor, the Greens and the Smart Energy Council criticised the move,
each noting part of the justification for lowering the tariff was that
wholesale prices had lately fallen.
"It's sort of sabotaging the clean energy transition," Adam Searle, Labor's energy spokesman, said.
"It
starts to unravel that downward pressure on wholesale prices" being
driven by rooftop solar and other renewable energy, he said.
A
Labor government would legislate a "mandatory and fair feed-in tariff",
Mr Searle said, adding that IPART's methodology used to set prices
would be "looked at closely".
Tamara Smith, a Greens MP, said the
price cut was a result of the Berejiklian government's failure to
instruct IPART "to assess the true value of solar".
It
should take into account "the avoided health and carbon costs solar
brings by reducing the amount of fossil fuels that are burnt", Ms Smith
said.
John Grimes, head of the Smart Energy Council, said solar PV
take-up would likely continue at a record pace despite the tariff cut,
with 380,000 NSW households already using panels.
More people,
though, would likely add storage as a result of the cut, and find ways
to match energy demand to their panels' output.
"People should be thinking about batteries and maximising self-consumption," Mr Grimes said.
According to Solar Choice, the NSW price currently paid varies widely
across retailers, with Mojo Power paying 20 cent per kilowatt-hour. The
NSW price compares with a minimum of about 11.3 cents for most
retailers in Victoria, while some towns in Western Australia pay as much
as 50 cents per kilowatt-hour exported.
Greenhouse
gases were the main driver of climate throughout the warmest period of
the past 66 million years, providing insight into the drivers behind
long-term climate change.
Antarctica
and Australia separated around the end of the Eocene (56 to 22.9 million
years ago), creating a deep water passage between them and changing ocean circulation patterns.
Some researchers believe these changes were the driver of cooling
temperatures near the end of the Eocene 'hothouse' period, but some
think declining levels of carbon dioxide were to blame.
If the cooling had been caused by changes in ocean circulation,
regions around the equator would have warmed as the polar regions
cooled, shifting the distribution of heat on Earth. But changing the
concentration of greenhouse gases
would affect the total heat trapped in Earth's atmosphere, causing
cooling everywhere (including in the tropics), which is what the
researchers found. The findings were published in the journal Nature.
The synchronized evolution of tropical and polar temperature we reconstructed can only be explained by greenhouse gas
forcing," said Margot Cramwinckel, a Ph.D. candidate at Utrecht
University in the Netherlands and first author of the paper. "Our
findings are uniquely compatible with the hypothesis that the long-term
Eocene cooling was driven by greenhouse gasses. This greatly improves
our understanding of the drivers behind long-term climate change, which is important in order to predict the development of future climate change."
Climate change often has more intense effects near the poles than
elsewhere on the planet, a phenomenon known as polar amplification.
The study found that temperature change was more dramatic near the
poles than in the tropics during the Eocene, even though most of the
period was extremely warm, leaving little to no ice near the poles.
"Even in a largely ice-free world, the poles cooled more than the
tropics as temperature dropped," Cramwinckel said. "This indicates that
greenhouse gas forcing by itself can cause polar amplification."
The researchers had one more question about polar amplification: does it reach some sort of limit?
"Our results support the idea that polar amplification saturates out
at some point in warm climates and does not continue to increase with
further warming," said Matthew Huber, a professor of earth, atmospheric
and planetary sciences at Purdue University and co-author of the paper.
As a proxy for temperature, the research team looked at membrane
lipids of simple, sea-surface dwelling organisms called Thaumarchaeota
that change their membrane composition as temperatures change in deep
sea sediment cores drilled near the Ivory Coast.
They combined these observations with climate models, produced by
Huber's team at Purdue, to mesh together a timeline of temperature
throughout the Eocene.
"The simulations took about four years of continuous computing to
achieve equilibrated climate states at various carbon dioxide levels,"
Huber said. "For the first time, the climate model is capable of
capturing the main trends in tropical sea surface temperatures and
temperature gradients across a range of climate encompassing nearly 20
million years. The only problem is that the simulations required more
carbon dioxide changes than observed, which demonstrates that this model
is not sensitive enough to carbon dioxide."
Historically, researchers have had trouble reproducing temperature
gradients between the tropics and the poles throughout the Eocene. These
new climate models are capable of overcoming most of the issues faced
by past models.
Kids today will be grandparents when most climate projections end—does the past have more hints?
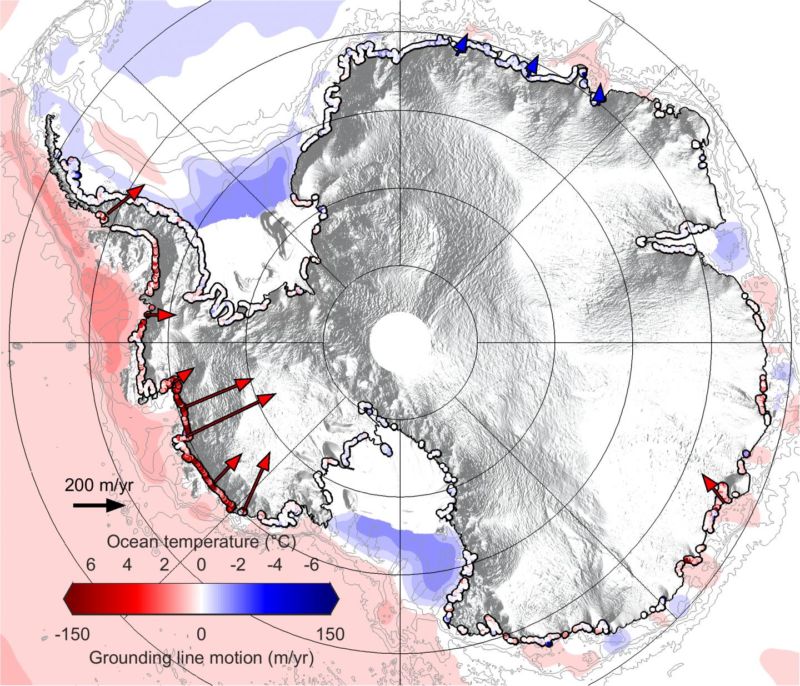
Map of Antarctica today showing rates of retreat (2010-2016) of the “grounding line” where glaciers lose contact with bedrock underwater, along with ocean temperatures. The lone red arrow in East Antarctica is the Totten Glacier, which alone holds ice equivalent to ~3m (10ft) of sea level rise. Hannes Konrad et al, University of LeedsLARGE IMAGE
"What's past is prologue"- Shakespeare’s The Tempest
The year 2100 stands like a line of checkered flags at the climate
change finish line, as if all our goals expire then. But like the
warning etched on a car mirror: it’s closer than it appears. Kids born
today will be grandparents when most climate projections end.
And yet, the climate won’t stop changing in 2100. Even if we succeed in limiting warming this century to 2ºC, we’ll have CO2 at around 500 parts per million. That’s a level not seen on this planet since the Middle Miocene, 16 million years ago, when our ancestors were apes. Temperatures then were about 5 to 8ºC warmer not 2º, and sea levels were some 40 meters (130 feet) or more higher, not the 1.5 feet (half a meter) anticipated at the end of this century by the 2013 IPCC report.
Why is there a yawning gap between end-century projections and what
happened in Earth’s past? Are past climates telling us we’re missing
something?
Time
One big reason for the gap is simple: time.
Earth takes time to respond to changes in greenhouse gases. Some changes happen within years,
while others take generations to reach a new equilibrium. Ice sheets
melting, permafrost thawing, deep ocean warming, peat formation, and
reorganizations of vegetation take centuries to millennia.
These slow responses are typically not included
in climate models. That’s partly because of the computing time they
would take to calculate, partly because we’re naturally focused on what
we can expect over the next few decades, and partly because those
processes are uncertain. And even though climate models have been successful at predicting climate change observed so far, uncertainties remain for even some fast responses, like clouds or the amplification of warming at the poles.
Earth’s past, on the other hand, shows us how its climate actually changed, integrating the full spectrum
of our planet’s fast and slow responses. During past climate changes
when Earth had ice sheets (like today) it typically warmed by around 5ºC to 6ºC for each doubling of CO2 levels, with the process taking about a millennium. That’s roughly double the “Equilibrium Climate Sensitivity” (ECS) values used in climate model projections for 2100, which are calculated mainly from historical observations.
"What is past is prologue", inscribed on Future (1935, Robert Aitken) National Archives Building in Washington, DC. LARGE IMAGE
“We do expect the Earth System Sensitivity (change CO2 and have all the systems react—including ice sheets, vegetation, methane, aerosols etc.) to be larger than ECS. Work we did on the Pliocene
suggested about 50 percent bigger, but it could be larger than that,”
Gavin Schmidt, director of the NASA Goddard Institute for Space Studies
in New York, told me.
Or, as Dana Royer of Wesleyan University put it, “In short, climate models tend to under-predict the magnitude of climate change relative to geologic evidence.”
Part of that greater magnitude is simply down to Earth’s slow
responses, which produce a net warming. Even if greenhouse gas emissions
were to cease completely tomorrow, sea levels are committed to keep rising for centuries from thermal expansion and melting glaciers; ice sheets in Antarctica and Greenland are also committed to keep melting from the heat already built into the climate over recent decades. And because CO2 lasts a long time in the atmosphere, in the absence of geoengineering to remove it, the world will overshoot any of our end-century temperature targets and stay elevated for centuries.
But those don’t explain the entire gap, which suggests we’re missing some other amplifying feedbacks. As the 2017 US National Climate Assessment
put it: “model-data mismatch for past warm climates suggests that
climate models are omitting at least one, and probably more, processes
crucial to future warming, especially in polar regions.”
Can the Miocene tell our future?
The Mid-Miocene Climate Optimum (MMCO) was an ancient global warming episode when CO2 levelssurged from less than 400ppm to around 500ppm. (Ancient CO2 is measured in a variety of indirect ways like isotopes of boron or carbon
in fossils and ancient soils, or from the pores on fossil leaves.) The
cause of that surge was a rare volcanic phenomenon called a “Large Igneous Province” that erupted vast quantities of basalt in the Western USA 16.6 million years ago. Yvette Eley and Michael Hren of the University of Connecticut have been investigating how that changed the climate.
The tool? Fat molecules left in sediments by plants and microbes that
lived at the time. Eley and Hren exhumed the chemical remains of
microbes from Miocene muds in Maryland and then converted ratios of
different fat molecules into soil temperature, using calibrations based
on more than a decade of study of microbe fats in modern soils all over
the planet. “Certainly, the timing of those flood basalts and the timing
of when we see the shifts are pretty, pretty tight,” said Eley. “Our
biomarkers definitely track what CO2 was doing. Whatever is happening in the terrestrial system in terms of what’s driving this event, it’s definitely following pCO2.”
As ancient climate changes go, the MMCO was mild compared to the end-Permian, end-Triassic, and others linked to mass extinctions. Miocene CO2 emissions were slow enough to avoid significant ocean acidification, for example, unlike today and during extreme past climate changes.
They also calculated sea temperatures in a similar way using
chemically distinct remains of marine microbes: “We have a relative
change across the MMCO of about 4-5 degrees [Celsius] in sea surface
temperature, and sea surface temperatures that are about 6 degrees
warmer than modern,” said Eley.
Warmer, wetter, dryer?
They gauged Miocene atmospheric moisture
by analyzing chemical traces of the waxy coating on plant leaves,
calibrated to modern values from a wide variety of environments. “If we
use our leaf-wax biomarkers as a proxy for atmospheric moisture, the
data we get suggests that it was getting wetter across the MMCO,” said
Eley. “It’s interesting to place our site in the context of other
reconstructions. The Western US became more arid, South America gets
wetter, parts of Europe get wetter, parts of Europe get dryer.”
Places as far afield as East Coast USA, the Pacific Northwest, Western China, Patagonia, Central Asia, and the Atacama in South America, all became much wetter, causing a global uptick in erosion. The result was a general expansion and densification of forests. Remarkably, there’s no sign of deserts either in North Africa or Asia, where today we have the Sahara and Gobi deserts.
That widespread wetting and greening is at odds with projected changes for our future, where areas that are currently wet are projected to get wetter, but dry areas are expected to get dryer. The difference may reflect the abrupt and unfinished nature of our climate change compared to the much slower Miocene change.
Even though landscapes right before the MMCO were already extensively
forested (unlike today’s, which reflect interglacial habitat deforestation by humans for millennia),
the Miocene warming still produced clear changes in vegetation around
the world, preserved in fossils, especially fossil pollen.
Across much of Europe, subtropical vegetation replaced cool-adapted plants, and dense swamp-forests resembling modern Louisiana clogged coasts and estuaries in Denmark and Germany (the European shoreline was 120 miles inland from today’s coast). Those swamps accumulated brown coal that now fuels about a quarter of German electricity generation. Spain
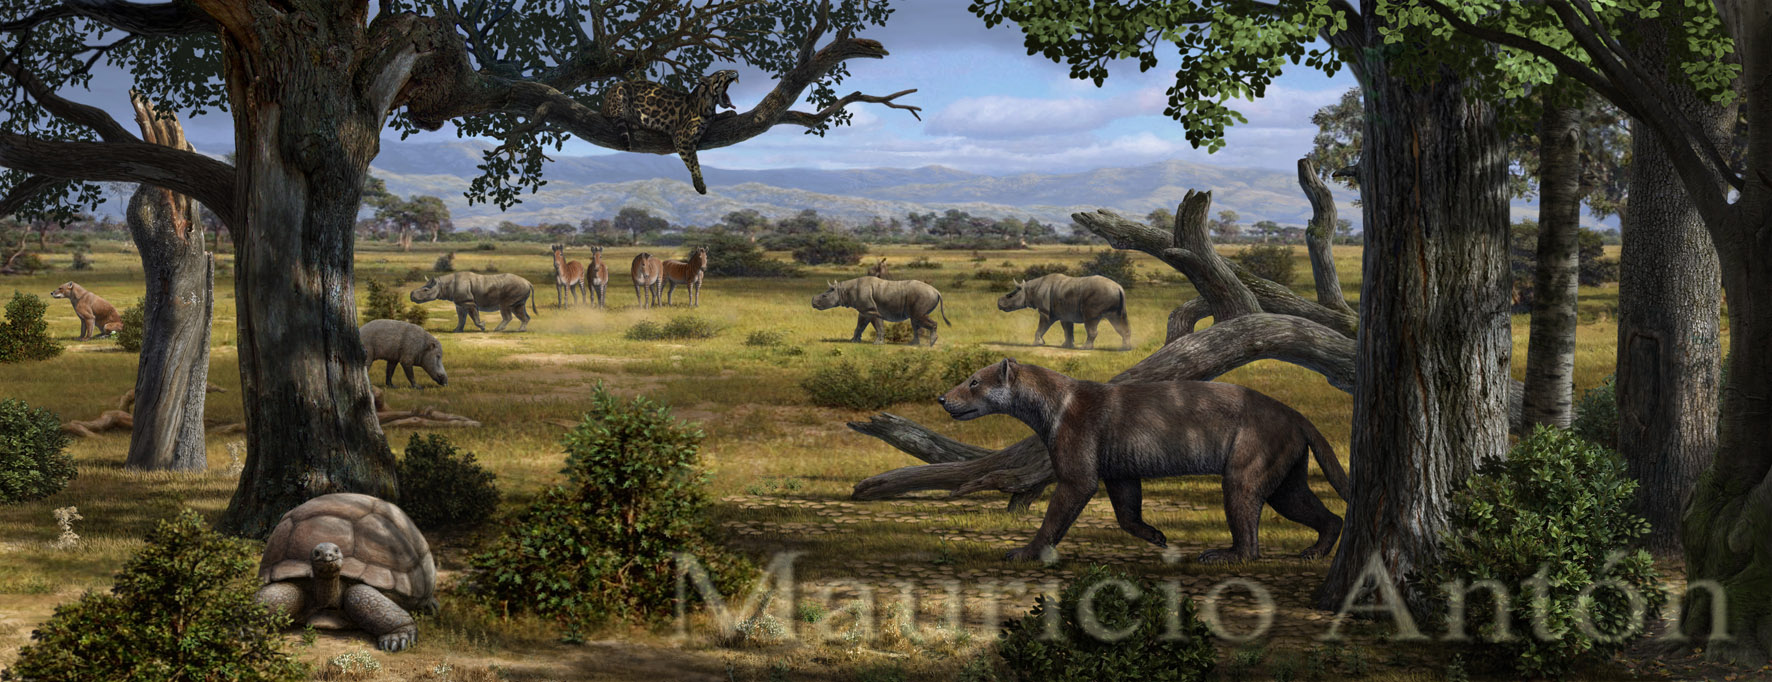
bucked the wet trend by having a hot, dry climate in the south, and a
warm and wetter climate in the north just like today, with long dry seasons.
An artist's rendition of mid-Miocene life in Spain. Mauricio AntonLARGE IMAGE
European vegetation also shows that there was less temperature contrast between seasons.
Siberia was rain-soaked with 3-5 times the precipitation of today, while swamps in Eastern Russia also accumulated coal. In Arctic Canada,
where these days it’s treeless permafrost tundra, the MMCO changed what
had been a cool-temperate forest of birch, elm, holly, and umbrella
pine into a warm-temperate forest rich in beech and hickory, sweetgum,
walnut, and lime trees.
Nearer the equator, early elephants and antelope roamed Arabia’s grassy, wet interior, while North Africa was lushly forested where Saharan sand dunes drift today. Apes spread across the forested planet, and it was about that time when great apes (our ancestors) diverged from other apes.
But it was Antarctica that altered most dramatically.
130 feet of sea level rise
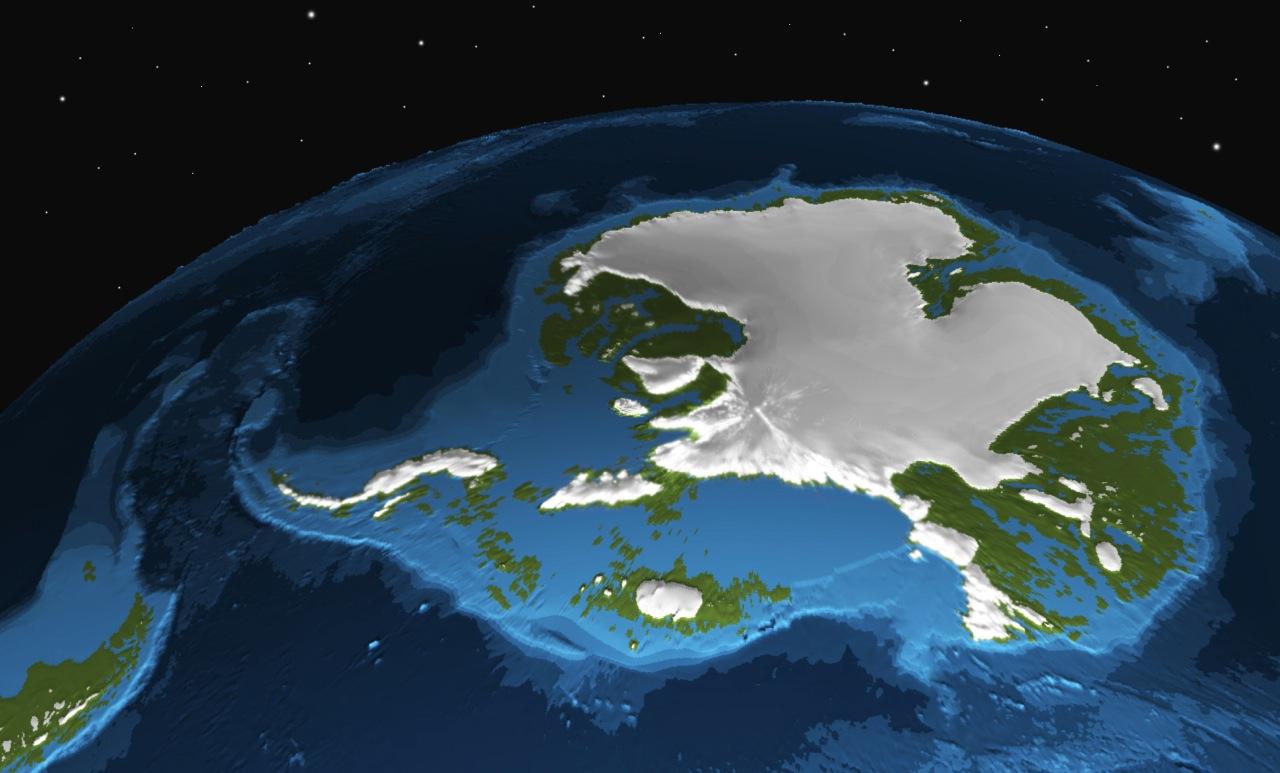
Between a third and three-quarters of Antarctic ice melted. Land liberated by retreating ice sprouted tundra and forests of beech and conifers, which can’t have happened unless Antarctic summers were warmer than 10ºC (50ºF—much warmer than the -5ºC/23ºF it is today). It’s not clear what Greenland was up to, but there may have been a small ice sheet in Northern Greenland that melted substantially.
Consequently, sea levels rose by a whopping 40 meters or so (~130 feet). To put that in perspective, Mid-Miocene-like sea levels today would draw a new US Atlantic coast roughly along Interstate 95 through Philadelphia, Baltimore, Richmond and Fayetteville, North Carolina, inundating
the New York-New Jersey-Connecticut metro area, Boston, most of
Florida, and the coastal Gulf of Mexico. Similar things would happen
across densely populated lowland areas around the globe, home to a quarter of the world’s people.
Forty meters is just a bit more than the latest projections for modern sea level rise of 1-3 feet by 2100, and 4.5 to 5.25 feet (1.4-1.6 meters—home to about 5 percent
of the world’s population) by 2300, assuming we stabilize warming to
around 2ºC. The difference is, once again, partly explained by time.
According to the 2017 US National Climate Assessment,
2ºC of warming would commit us to a loss of three-fifths of Greenland’s
ice and one third of Antarctic ice, resulting in 25m (80ft) of sea
level rise—but occurring over 10,000 years.
Even so, the Miocene hints that modern sea level rise could be larger and more rapid.
Sediments offshore of East Antarctica show that its ice was highly sensitive to even small changes in CO2 levels and orbital wobbles during the Miocene, responding with fast melting rates. How fast? Edward Gasson, of Sheffield University UK, and colleagues, calculated that Antarctica may have initially raised sea levels by roughly eight feet per century, tapering off to 30-36 meters
(98-118 feet) after 10,000 years. That rate is consistent with a
projection by Robert DeConto of Penn State and David Pollard of Amherst,
based on the Pliocene, which had a cooler climate than the Mid-Miocene
and sea levels “only” about 20 meters higher than today. DeConto and Pollard inferred that modern warming of about 2.5ºC in 2100 would raise sea levels 5.7 meters
(19 feet) by the year 2500—about four feet per century. This rapid
change may seem extreme, but we know that at times during just the past
500,000 years, sea levels have risen by as much as 4 to 5.7 meters (13 to 19 feet) per century.
If modern sea level rise turns out to be a Pliocene-like 4 feet per
century, or a Miocene-like 8 feet per century, instead of the IPCC’s 1.5
feet, we’re facing a very different future. Sea level rise, compounded by tidal flooding and storms, would render large amounts of coastal infrastructure and property worthless in a generation or two (a mortgage or two).
Computer models did not support such rapid melting—until now.
Ocean-driven melting that undermines and destabilizes ice sheets was critical in the Miocene and seems to be so again today.
That process can trigger runaway “Marine Ice Sheet Instability” as
glaciers retreat inland—counterintuitively—into deeper basins due to
Antarctica’s bowl-like bedrock topography. The deeper they get, the more
ice melts from below because it’s at higher pressure, and the thinning
glaciers tend to float, so they recede farther inland and accelerate,
until they form tall cliffs that break apart under their own weight
(“Marine Ice Cliff Instability”), making the situation worse.
Worryingly, this may already be beginning in Antarctica. Surface melt water, which requires air temperatures above freezing, is another accelerant. It seeps into cracks and freezes, fracturing ice like a log-splitter, a phenomenon witnessed in the demise of Greenland’s Jakobshavn Glacier. Again, ice surface melting is happening today in parts of Antarctica. These melt-amplifying processes have only recently been added to new computer models, and now they show that ancient rates of sea level rise are possible for our descendants.
Retreating ice amplifies global warming by exchanging bright,
reflective ice with darker, more heat-absorbent water and land. As a
result, temperatures will slowly rise further.
What the Antarctic Ice Sheet may have looked like during the Miocene, 14 to 23 million years ago. UMass Amherst / Edward GassonLARGE IMAGE
Hope in uncertainty?
Could some of the gap between the Miocene climate and our projected
future just be due to the sparseness and wide uncertainties in ancient
climate data?
“CO2 changes in the Mid-Miocene might be larger than the median value reported. Other drivers are not known about at all. Methane or N2O
levels are completely unknown. The amount of ozone or black carbon
(from fires or vegetation emissions) are similarly uncertain,” Gavin
Schmidt told me. “Thus, even if we had perfect global temperature
proxies (which we don’t), estimates of sensitivity gotten from dividing
the temperature by the CO2 forcing alone are not comparable with ECS estimates for today.”
And yet, despite a spread of values for CO2 levels, proxies do cluster around 500ppm for the Mid-Miocene; somestudies even suggest Mid-Miocene CO2 might have been lower yet driven even warmer temperatures. A relatively warm climate is supported by geological evidence for high sea levels and by fossils around the world, including offshore Antarctica.
Was it exaggerated by orbital cycles? Although individual Miocene glacial cycles were driven by orbital wobbles just like in the last ice age, warmth and maximum ice retreat persisted through several orbital and glacial cycles, tracking the higher atmospheric CO2. So we can’t pin the MMCO just on Earth’s orbit around the Sun.
Confusing matters further, the Miocene world started out different
from today. The early Miocene climate was warmer than our preindustrial
climate, grasslands had not yet proliferated, and the oceans were connected differently, with a current flowing from the Pacific to the Atlantic through what is now Panama, while the Bering Strait was closed. Yet scientists think the currents probably didn’t have much of an effect on the climate, and in many other ways the planet was quitesimilar to today.
So there are big uncertainties in how well the Miocene represents our
descendants’ future. It’s also true that there is no analog for the
rapid rate of modern emissions in at least the last 66 million years.
You could reasonably dismiss the relevance of any ancient analog on
those grounds. But bear in mind that uncertainty is a double-edged
sword: it cuts both ways, not only in the comforting direction.
If all of this feels depressingly “doomist,” there is hope! It lies
in Earth’s slow reaction time, which gives us a (limited) window of
opportunity.
"Sea Level Rise: Some Reason for Hope?" by Peter Sinclair and Yale Climate Connections.
A hand in the flame
If you pass your hand through a candle flame quickly enough, you
won’t get burned. The same principle applies to Earth—if we minimize the
time that the planet spends above preindustrial temperatures, Miocene-like sea level rise may be avoidable.
Although Greenland and West Antarctic ice is already melting at an accelerating rate, East Antarctica is—for now—relatively stable (except the Totten Glacier). So, if we can keep warming wellbelow 2ºC, DeConto and Pollard’s models suggest East Antarctica will contribute little to future sea level rise.
But this will require us to reduce greenhouse gas concentrations, going beyond achieving “Net Zero” emissions.
“Negative emissions” (actively sucking CO2 out of the air) could slowly reduce global temperatures and stabilize
many sources of sea level rise during the 22nd century. According to
Matthias Mengel of the Potsdam Institute for Climate Impact Research and
colleagues, falling CO2 would eventually allow Antarctica to begin accumulating ice, so sea levels would begin to fall again, three centuries into the future.
But this assumes negative emissions technologies can be deployed massively by the 2030s, a scenario with “limited realistic potential.” Every five-year delay could commit our descendants to an extra 1 meter (3 feet) of sea level rise by 2300. Avoiding this future also assumes we don’t trigger widespread ice sheet collapse in the meantime. If that happens, it will be effectively irreversible for millennia, even with removal of CO2 from the atmosphere.
Our present window of opportunity may not be open for long—scientists are scrambling
to see if ice sheet collapse is starting in one of the largest glaciers
of West Antarctica.“Things are changing now very, very fast relative to
a lot of what we see in the geological record,” said Eley. “I would
love to think that we’re not going to end up with some of the worst-case
scenarios, but we’re already, I think, on a path to hitting those sorts
of levels.”
“[CO2] shows 100 to 200ppm increase in the middle Miocene.
We’ve already bumped it up 127 since preindustrial. We’re halfway
there,” said Hren. “The uncertainties are not simply the CO2 that we’re going to get to, but really how the system will respond to something that is changing so rapidly.”
*Howard Lee is a freelance science writer focusing on climate
changes in deep time. He has a bachelor's degree in geology and masters
in remote sensing, both from University of London, UK. Links
The lawsuit blames the burning of fossil fuels for contributing to sea level rise, extreme weather and warming oceans. The state's already seeing coastal damage.
“For a very long time, there has been this perception that ‘Big Oil’ was
too big to take on, but here we are – the smallest state – taking on
some of the biggest corporate polluters in the world,” Rhode Island
Attorney General Peter Kilmartin said in announcing the lawsuit. Credit:
Marc Choquette/CC-BY-2.0
Rhode Island on Monday became the first state to sue oil companies
over the effects of climate change, filing a complaint seeking damages
for the costs associated with protecting the state from rising seas and
severe weather.
Standing atop a seawall in Narragansett, state Attorney General Peter
F. Kilmartin compared the case to the lawsuits filed decades ago
against tobacco companies and said it would hold the companies—including
ExxonMobil, Chevron, BP and Royal Dutch Shell—accountable for harm they
have caused.
"Big oil knew for decades
that greenhouse gas pollution from their operations and their products
were having a significant and detrimental impact on the earth's
climate," he said. "Instead of working to reduce that harm, these
companies chose to conceal the dangers, undermine public support for
greenhouse gas regulation and engage in massive campaigns to promote the
ever increasing use of their products and ever increasing revenues in
their pockets."
The lawsuit,
filed in Providence/Bristol County Superior Court, names 14 oil and gas
companies and some of their affiliates, saying they created conditions
that constitute a public nuisance under state law and failed to warn the
public and regulators of a risk they were well aware of. It follows a
series of similar lawsuits filed by local jurisdictions around the
country.
Rhode Island is known as the Ocean State—it has more than 400 miles
of coastline—and officials stressed the risks that coastal communities
face as a result of rising seas. Kilmartin noted that the area where he
was standing could be underwater if a major storm were to hit later in
the century, when the seas are several feet higher.
"As a direct and proximate consequence of Defendants' wrongful
conduct described in this Complaint, average sea level will rise
substantially along Rhode Island's coast; average temperatures and
extreme heat days will increase; flooding, extreme precipitation events,
such as tropical storms and hurricanes, and drought will become more
frequent and more severe; and the ocean will warm and become more
acidic," the lawsuit states.
It says Rhode Island is already seeing the effects, and taxpayers are left to pay the costs.
Shell released a statement
to Reuters saying that "lawsuits that masquerade as climate action and
impede the collaboration needed for meaningful change" were not the
answer to climate change.
Latest in a Wave of Lawsuits
More than a dozen cities and counties
in California, Colorado, New York and Washington have filed similar
lawsuits against major fossil companies in recent months in attempts to
hold them financially responsible for the effects of climate change.
Many of those cases involve coastal communities—such as New York City and tiny Imperial Beach,
California—that have seen the damage sea level rise can cause and are
now looking for how to pay for protective infrastructure.
The fossil fuel industry has been fighting to have these cases dismissed or moved to federal court, where it faces better odds of having the cases thrown out.
That tactic succeeded last month,
when a federal judge in California dismissed the lawsuits filed by San
Francisco and Oakland. In his decision, U.S. District Judge William
Alsup wrote that the dangers of climate change are "very real" and that
fossil fuel companies didn't dispute that burning their products causes
it, but that the issue should be handled by Congress rather than in a
federal liability lawsuit.
State courts, where other lawsuits are still being handled, may take a different view.
'A Greater Burden on States to Take Action'
Sen. Sheldon Whitehouse (D-RI), who spoke at the press conference
announcing Rhode Island's lawsuit, said the courts are an appropriate
venue.
"The fossil fuel industry is fond of saying, you're in the wrong
forum, you shouldn't be going to the courts, you should be going to
Congress," he said. "The reason they say that is because they have
Congress locked up with their political power and their money and their
influence."
Rhode Island Gov. Gina Raimondo said the Trump administration's inaction on climate change means that states must do more.
"Given that we have a president in the White House who denies climate change and has pulled out of the Paris climate accord,
it puts a greater burden on states to take action," she said. "If the
federal government isn't going to do their job, we'll do it for them."
Independent Australia - Graeme McLeay* When a large number of apparently sane people suggest, not only prolonging existing coal-fired power but building more coal-fired power stations, we must consider what is causing the psychosis, writes Dr Graeme McLeay.
Cartoon by Mark David
IT IS INCUMBENT on a doctor to get the diagnosis right.
When a patient comes complaining that he has been abducted by aliens,
psychosis comes to mind. But when others follow who are also seemingly
deranged, the doctor must search more widely for the cause.
And so it is with Canberra when a large number of apparently sane
people suggest, not only prolonging existing coal-fired power but
building more coal-fired power stations.
Was it an infection they picked up on a visit to the climate-denyingHeartland Institute? Or something in the environment, perhaps? Maybe it's that lump of coal they passed round in Parliament?
How is it that so many of our elected representatives are so divorced from scientific reality?
Global warming and its resultant climate change is no longer a theory.
It is a stark reality, as even a casual reader must grasp:
And the list goes on. Already the effects on human health and well being are widespread.
How strange it is that some in the National Party seem also to be
afflicted with this condition. It is the regional areas which have so
much to lose unless we mitigate and adapt to climate change. Drought is a
natural phenomenon in Australia but scientists have warned that the southern half of our continent is drying. Cereal crops have an optimal temperature for growth and in extended heat waves productivity falls off dramatically. But it’s the economy! they all shout — as if the economy was
somehow divorced from nature. Australia’s emissions – which are
possibly under-estimated because gas is not properly measured – are
“only” 1.3 per cent of the global total, they say. But added together
with similar sized nations, we make up 40 per cent of the global total. Australia’s emissions are rising – even now – and have been since the carbon tax was abolished.
Near the top of the league table for emissions per capita, we are part
of the problem rather than being part of the solution as we could so
easily be.
Leaving aside Canberra’s delusional sickness, climate change and the pollution from fossil fuels
are very real health threats to Australians, especially the young who
continue to be exposed to pollution from coal and transport and under
the business as usual – or worse – scenario expressed by Kelly, Morrison, Abbott and others, will be for a long time to come.
These tickers show the unrelenting rise in global temperatures and carbon dioxide.
It’s getting hot in here. NASA/Getty Images
Global warming isn’t something that will happen decades down the line — it’s happening every day, bit by bit.
It’s possible now to actually see the concentration of
greenhouse gases and the energy they trap ticking ominously upward in
real time.
Brian Kahn at Earther highlighted a clock that shows the rising global warming index:
The ticker was built by researchers at the University at Oxford and the
University of Leeds, and it’s based on their paper published in Scientific Reports last November that tracks warming due to human activity relative to the pre-industrial era of the mid-19th century.
The Current GWI, steadily ticking upward, represents the
amount that burning fossil fuels and other human endeavors have driven
up the planet’s temperature, while accounting for natural variations in
the climate to isolate humanity’s role. You can dig into all the details
on how they made it here. If you want to step further into the rising tide, there’s another, more frenetic ticker
from the University of Oxford showing the rise in greenhouse gases,
counting up toward humanity’ trillionth metric ton of carbon dioxide
emissions:
In 2015, Bloomberg published a carbon clock that measures rising atmospheric concentrations of carbon dioxide. (The team also helpfully published the methodology behind their calculations.)


/cdn.vox-cdn.com/uploads/chorus_asset/file/11621561/GWI_1.gif)
/cdn.vox-cdn.com/uploads/chorus_asset/file/9728947/DeathSlinky.gif)