25/11/2021

(AU) From Rhetoric To Action – Academies Release Joint Statement On COP26

Australian Academy of Science


The presidents of Australia’s five learned academies have issued a joint statement on COP26 and Australia's path to net-zero emissions.

The statement promises the academies’ independent voice and convening power, which harnesses the collective expertise and resources of nearly 3,500 Fellows across the academies, to provide insights, solutions and knowledge.
[The presidents] recognise that our Academies’ collective expertise and leadership is critical to addressing the widespread and intergenerational impacts of climate change.
Photo:Gustavo Fring via Pexels.

From the statement

 “[The presidents] recognise that our Academies’ collective expertise and leadership is critical to addressing the widespread and intergenerational impacts of climate change.

"At COP26 in Glasgow, world leaders convened with a singular goal – to drive deep and rapid decarbonisation to limit global warming to 1.5 degrees Celsius.

"There is no realistic path to decarbonisation without ending fossil fuel use.

"In response, every sector in Australia must deliver on our commitments to reach the global goals stated in the 2015 Paris Agreement.

“The challenges presented by climate change require smart, holistic and cross-disciplinary thinking. We need to continue developing and communicating research to challenge misinformation with robust evidence and steward an economy-wide transition to a low carbon future.

"Our academies will work to ensure our experts are at the forefront, providing advice to guide the most efficient, fair and cost-effective policy mechanisms that drive reductions in greenhouse gas emissions and broader adaptation.

“Strategies will aim to exceed our emission reduction targets while effectively managing social, economic, health and environmental factors and empowering governments and industry to take action. We are also committed to substantially reducing the emissions of our own academy activities.”

Work underway

Learned academies and ACOLA are already undertaking valuable work towards net-zero, including:

The statement is signed by the presidents of Australia’s learned academies: Links

(AU The Conversation) Climate Change Is Likely Driving A Drier Southern Australia – So Why Are We Having Such A Wet Year?

The Conversation

Shutterstock

Author
 is Climate projections scientist, CSIRO     
As the climate changes, southern Australia is likely to keep getting drier on average, particularly in the southwest.

However, this year has been wet. And yesterday the Bureau of Meteorology announced we are now in another La Niña event. This common large-scale climate pattern lasts for months, and will increase the odds of further wet weather across the country.

So despite the long-term trend towards drier conditions, we find ourselves in a wetter-than-usual period. What gives?

Current climate change assessments

Rainfall has been declining in much of southern Australia in recent decades (see below). The Intergovernmental Panel on Climate Change’s Sixth Assessment report – which draws on the latest climate research – found the recent drying trend in southern Australia is likely to continue, particularly during the cool season.

Cool-season rainfall in southwest Western Australia has already decreased, and ongoing drying in this area is assessed to be very likely. There’s strong evidence this trend contains a “signal” of climate change, otherwise known as a climate change “fingerprint”.

We understand the drying has been driven by changes in dominant weather patterns. And future projections of drying in the southwest are among the strongest in the world.

The situation in the southeast of Australia is not as clear, but there’s strong evidence for an ongoing decrease in rainfall here, too.

Yet, we find it has been wet in many southwest and southeast regions this year – including in the cool season. In fact, some areas received “very much above average” rainfall in the ten months to the end of October, seemingly defying the drying trend.

Left: trend in annual rainfall since 1950. Right: rainfall deciles for Jan-Oct 2021.
LARGE IMAGE


Variability is king in Australia

Australia has always been the land of droughts and flooding rains. It’s normal to be beset by a multi-year drought, before experiencing major floods. Year-to-year variability here is large compared with most of the world’s other land regions.

In 2021, we’ve seen a wet swing of the climate needle due to several global climate drivers. Alongside the Pacific now being in the La Niña phase, the Indian Ocean Dipole is in a negative phase.

When we see these drivers line up, we know the deck is stacked for a wetter season. This is what we’ve always found, and we can count on Australia’s climate variability to remain, through this century and beyond.

So does a wet year cast doubt on our assessment of climate change? No.

In the 2020 State of the Climate report, released by the CSIRO and the Bureau of Meteorology, we noted recent rainfall trends are tracking within projections.

Left: projected change in average precipitation at 3°C of global warming. Brown indicates decrease and green indicates increase. Right: projected change in heavy rainfall days (average heaviest daily rainfall of the year). Results show the average of all climate models (a central estimate) from the latest round of global modelling performed. Note there is a range of results around this model average. IPCC Interactive Atlas

In fact, we showed rainfall trends since the baseline of 1986-2005 to 2020 are tracking in the dry end of projections for the southwest and Victoria. This suggests that if anything, the projections are likely conservative.
Of course there are wet years, such as this year and also Victoria in 2010. But the longer-term trend has been downward. This is consistent with what we expect from climate change, after drawing on multiple lines of evidence and climate modelling.

2021 is not extraordinary in the long-term context. Even if the whole of 2021 ends up being very wet, it won’t shift the long-term trend by much. Only a persistent wet trend over decades or longer would raise questions about our assessment of climate change and current projections.

What does a ‘drier’ climate look like?

As the global climate warms, global average rainfall is increasing – and we expect most regions of the world will actually become wetter.

But there are some regions which will get drier, including southern Australia, the Mediterranean and southern Africa. So what will this look like?

A trend towards a drier climate will come with a lot of ups and downs. For example, between 1900 and 2020 southwest Western Australia’s annual rainfall varied between about 393mm and 1035mm (-40% and +55% from the average). This is a huge range.

Climate projections suggest a persistent rainfall reduction of up to 15% in the southwest of Australia is plausible over the first part of this century. Change later in the century will depend on whether we limit further climate warming.

If we do limit it, we can expect the rainfall to decrease by up to 20%. If we don’t, it will decrease by up to 35% – with larger reductions very plausible in the cool season. In either case, these projected average changes are still smaller than the year-to-year variability recorded in Australia over many decades.

But this doesn’t mean the trends and projections aren’t important. A persistent and ongoing shifting towards drier conditions, with drier (and hotter) dry spells is a huge challenge for Australia’s water managers and primary producers. And with a lower rainfall average, the chances of unprecedented dry periods are higher.

Wet extremes expected

But not every year will be a drought. There will still be wet days, months and years.

In fact, wet extremes are likely to increase despite the drying trend. Even in regions where the average rainfall is expected to decrease, there is a projected increase in intense rainfall bursts and rainfall extremes.

This includes intense hourly rainfalls that can lead to flash floods, as well as major rainfalls from “atmospheric rivers”, which are strong channels of concentrated moisture that stream through the atmosphere above us, delivering water for extreme rainfalls.

So for parts of southern Australia, a likely outcome is lower rainfall on average, but an increase in extreme rainfall events. With lower water availability overall, punctuated by intense flood risk, we can anticipate significant challenges ahead.

Links

(AU ABC) What Is The La Niña And What Does It Mean For Australian Weather?

ABC Weather - Kate Doyle

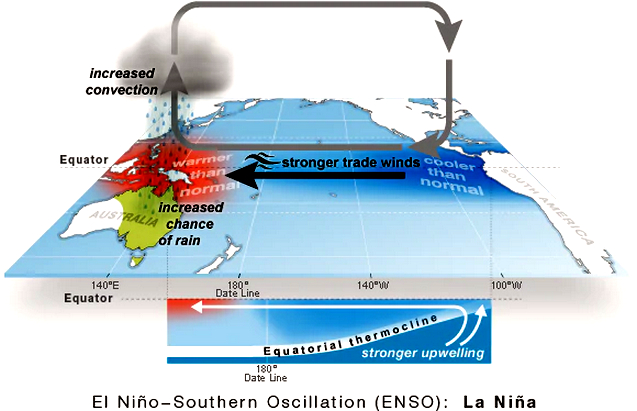
During a La Niña there are warmer than average waters in the western Pacific near Australia and cooler than average in the east. (Supplied: NOAA October 2021)

Invisible to us mere mortals on the ground, the atmosphere is full of giant circulations which transport, mix and disperse air and energy around the world.

One of these giant eddies is called the Walker Circulation.

The Walker Circulation strides the Pacific Ocean, rising in the west in the warm waters near Australia, pushing up and over the Pacific and descending near South America before racing back across the Pacific Ocean to form the trade winds.

Under normal conditions the Walker Circulation drives the trade winds across from the east to the west of the Pacific. (Supplied: Bureau of Meteorology)

La Niña is the term used to describe when the Walker Circulation is on steroids.

The western Pacific is even warmer than usual, the trade winds are stronger and all this moist energetic air is pushed onto Australia.

When there is a La Nina the Walker Circulation intensifies bringing wet and warm conditions to Australia. (Supplied: Bureau of Meteorology)


La Niña is therefore typically associated with wetter than average conditions for northern and eastern Australia, particularly in winter, spring and early summer.

La Niña events are typically associated with above average rainfall for northern and eastern Australia. (Supplied: Adobe Stock)

When the Walker Circulation is weakened, or even reversed, it is called the El Niño.

With the air now rising near South America and falling over the cooler-than-average oceans near Australia, less moisture is available and lift is discouraged, often resulting in drier than average conditions for northern and eastern Australia.

When there is an El Nino the Walker Circulation is reversed and downward pushing air brings dry conditions to Australia.(Supplied: Bureau of Meteorology)

What's in a name?

Together La Niña and El Niño are often referred to as the El Niño Southern Oscillation or ENSO.

The name El Niño was coined by South American fishermen in the 1600's who noticed unusually warm waters that often peaked around Christmas time.

They named the phenomena after 'El Niño de Navidad' after the Christ Child.

This evolved into just El Niño, 'the boy' and La Niña, 'the girl' to describe the opposite phase.

'La Niña' is the the girl child of the Pacific who brings flooding rains. (Supplied: Jenita Enevoldsen)

For any real keen weather watchers out there, there is another ENSO phase called El Niño Modoki. Where Modoki means 'same but different' in Japanese.

Or more boringly referred to as a Central Pacific El Niño.

This phase is when the air rises in the centre of the Pacific descending on both sides and discouraging rain.

What does La Niña mean for Australia?

Straight off the bat, no two La Niña events are exactly the same.

La Niña conditions don't cause any one individual downpour, rather they stack the underlying conditions full of moisture for when any individual weather event does come along.

La Niña's impact on summer rainfall is, in general, relatively less than it is in winter and spring but as it combines with the typical wet season for much of the north it can still help make things pretty wet. (Supplied: Bureau of Meteorology)

La Niña summers are therefore typically wetter than average and the warmer oceans also favour tropical cyclones.

The increased rainfall also results in increases in mosquito-borne diseases.

Big La Niña events of the past include the 1973 to 1976 La Niña, which was the longest sustained period of La Niña on record.

1974 still stands as Australia's wettest year on record and 1973 and 1975 also made the top five.

Brisbane's CBD was inundated in January 1974. (Royal Historical Society of Queensland)

Perhaps the most memorable event from these years was when Cyclone Wanda flooded Brisbane in the January of 1974.

More recently, 2010 to 2012 is notable for having two big La Niña summers in a row.

2010 and 2011 combined, resulted in the wettest 24 months on record.

Flooding was widespread from spring 2010 through to the end of summer 2011 — up and down the east coast.

Horror flash flooding washed away Grantham in South East Queensland's Lockyer Valley and Brisbane again went under water.

Lang Park under water during the 2011 floods. (Nearmap.com)

As these examples demonstrate, having two La Niña years in a row is fairly common.

This year's La Niña is again following on from one last year.

But thankfully this combination is not expected to be as extreme as these big events of the past.

How does La Niña impact the world?

La Niña typically also brings wetter than average conditions to the nations north of Australia in our summer.

La Niña has flow-on effects that impact rainfall in many regions around the world. (Supplied: International Research Institute for Climate and Society Columbia University)

A La Niña will typically lead to drier than average conditions for the southern US over their winter.

A study published in Nature found ENSO may have had a role in 21 per cent of all civil conflicts between 1950 and 2004, and that new civil conflicts in the tropics were twice as likely to arise during El Niño years than La Niña.

La Niña and El Niño are not the only drivers

ENSO is only one of a set of climate systems that affect Australia.

The Indian Ocean Dipole (IOD) is the other main year-to-year driver that influences Australia.

It gained household notoriety recently after its persistent positive phase took most of the blame for the drought that culminated in the 2019/2020 fires.

But other drivers like the Southern Annular Mode (SAM), and the Madden Julian Oscillation (MJO), also play a part.

These are just some of the climate influences on Australia as explained by the Bureau of Meteorology. (Supplied: Bureau of Meteorology)
These drivers can work to counter each other out or enhance the overall impact, as has been the case this spring as the developing La Niña and the decaying negative IOD have combined to encourage rain.

These drivers are happening on top of the backdrop of climate change, with seasonal changes and individual systems in the foreground.

It is a wonderfully complex world out there.

Links