
 |
| CREDIT: Global Carbon Project |
This was a big year in climate science and solutions. We learned a number of truly astounding things, which generally makes for great charts.
Clean energy progress
My candidate for the top solutions chart of the year comes from a November DOE report, “Revolution…Now The Future Arrives for Five Clean Energy Technologies.” It shows the stunning progress core clean energy technologies have made in the last several years as accelerated deployment created economies of scale and brought technologies rapidly down the learning curve.
 |
We also learned this year that, just as the solar photovoltaics crossed a key price point several years ago — which initiated explosive growth in PV nationally and globally — “Electric Car Batteries Just Hit A Key Price Point,” which means electric vehicles are likely to continue their recent exponential growth.
A true emissions plateau?
The runner up for top “good news” chart comes from a Global Carbon Project journal article released earlier this month, “Reaching peak emissions.” The GCP concludes, “Rapid growth in global CO2 emissions from fossil fuels and industry ceased in the past two years, despite continued economic growth. Decreased coal use in China was largely responsible, coupled with slower global growth in petroleum and faster growth in renewables.”
|
| CREDIT: Global Carbon Project |
When you combine China’s accelerated action with the successful Paris Agreement and the ongoing cleantech revolution, it seems clear that 2014-2015 marks an inflection point in the CO2 emissions trend line — and could even represent a true plateau. If so, then you can expect to see a version of this chart in the “top charts of the year” for a while to come.
CO2’s direct impact on cognition
There were plenty of worrisome scientific reports this year, but none more unexpected and more potentially impactful than the landmark public health finding from the Harvard School of Public Health that carbon dioxide (CO2) has a direct and negative impact on human cognition and decision-making. Significantly, these impacts have been observed at CO2 levels that most Americans — and their children — are routinely exposed to today inside classrooms, offices, homes, planes, and cars.
They found that, on average, a typical participant’s cognitive scores dropped 21 percent with a 400 ppm increase in CO2. Here are their astonishing findings for four of the nine cognitive functions scored in a double-blind test of the impact of elevated CO2 levels:

The key point is that outdoor CO2 levels are the baseline for indoor levels, which are typically 200 to 300 ppm higher in well ventilated buildings, but far higher than that in poorly ventilated buildings. We are at 400 parts per million (ppm) of CO2 today outdoors globally — and tens of ppm higher in many major cities. We are rising at a rate of 2+ ppm a year, a rate that is accelerating.
Significantly, we do not know the threshold at which CO2 levels begin to measurably impact human cognition, but it appears to be well below 1000 ppm. Even after Paris, we are still on a path to 675 ppm, which is too high for both the climate change impacts and the direct human cognition impacts. Given the importance of this story, I will be reporting on it a great deal in 2016.
No ‘pause’ in global warming
Two more charts merit attention. First, 2015 was the year it finally became obvious there was never any “pause” or “hiatus” in surface temperature warming. Of course, scientists had pointed out that the oceans, where more than 90 percent of human-caused global warming heat goes, have seen an acceleration in warming in recent years. As climate expert John Abraham writes in the Guardian, “The oceans are warming so fast, they keep breaking scientists’ charts.”
But the climate science deniers and some in the media had been trumpeting a supposed slow down in surface air temperatures. That myth was smashed back in January, when Gavin Schmidt, director of NASA’s Goddard Institute of Space Studies, tweeted, “Is there evidence that there is a significant change of trend from 1998? (Spoiler: No.)” He attached this chart:
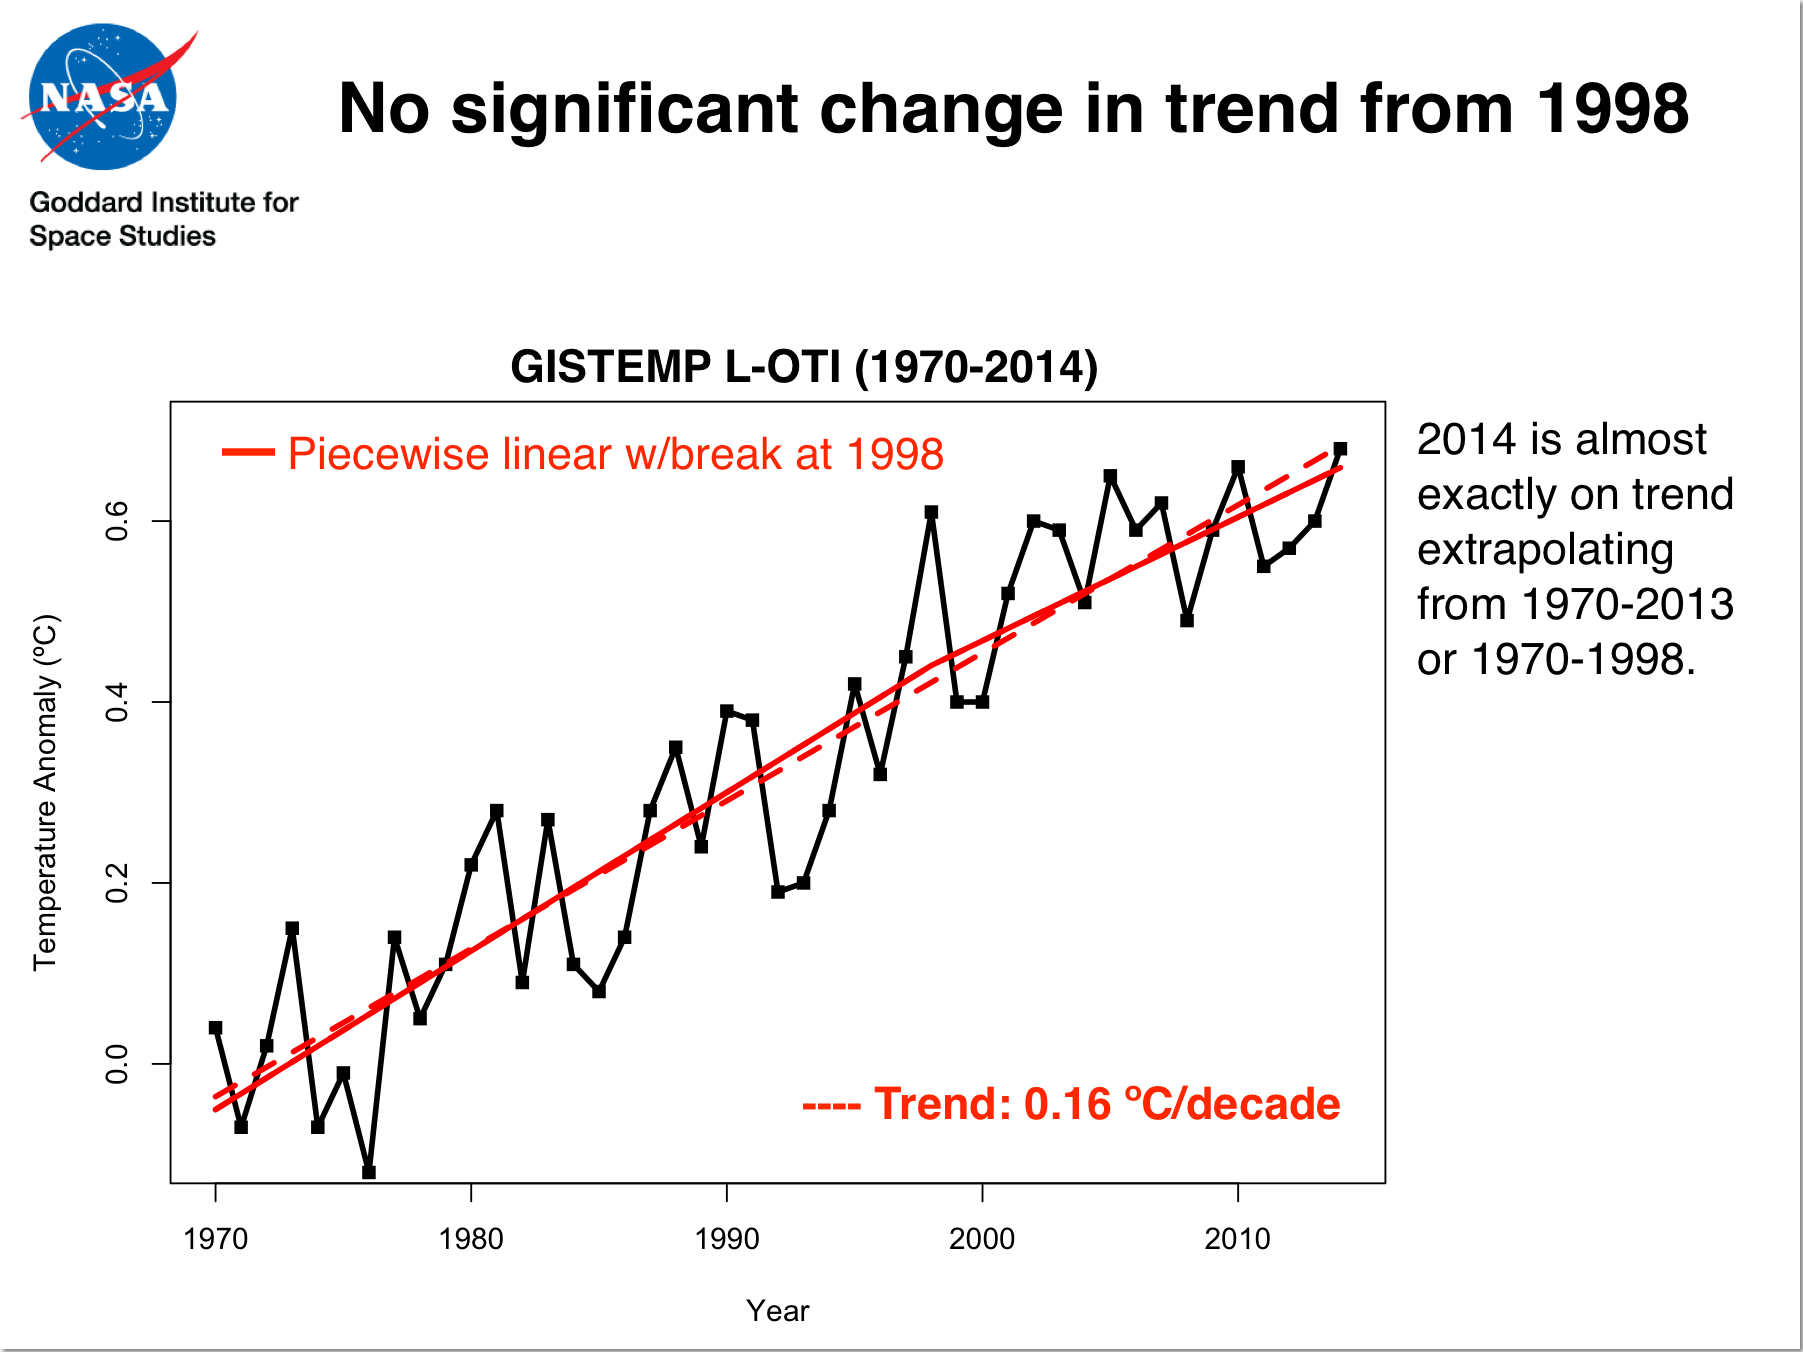
NASA temperature data make clear that not only
has there been no “pause” in surface temperature warming in the past
decade and a half, there hasn’t even been a significant change in trend.
A call for post-Paris action
Finally, in 2015, NASA gave us a chart that was a reminder of why it is so crucial for us to slash carbon pollution, why every nation including ours must keep ratcheting up our CO2 targets every five years as we promised in Paris.
If we don’t keep taking stronger and stronger action on climate change over time, here is what a 2015 NASA study projected the normal climate of North America will look like. The darkest areas have soil moisture comparable to that seen during the 1930s Dust Bowl.

No comments :
Post a Comment