02/06/2021

(Big Think) Hey, Methane Leakers: Now We Know Where You Live

Big Think

A European start-up uses satellite data to pinpoint individual sources of abnormal methane concentration.

World map of abnormal methane emissions, thanks to a tech start-up and satellite data. Image: Kayrros

Summary
  • Just 100 sources of methane emit 20 megatons each year.
  • Thanks to satellite data, individual culprits can now be found.
  • The new tech could be used to police 'abnormal' methane emissions.

Significant contributor to global warming

Nodding donkey in Midland, Texas. The oil and gas industry is a major emitter of methane. Image: Eric Kounce TexasRaiser, public domain

Methane is the second most important greenhouse gas (after CO2), and its concentration in the atmosphere is increasing at around 1% each year.

Because it absorbs the sun's heat even more efficiently than CO2, it's a significant contributor to global warming.

 The first step to fight the rise in methane emissions is to track who's doing it. That's just become a lot easier. Paris-based tech start-up Kayrros can now find individual sources of abnormal methane emissions, all across the world.

That's a first, and it's made possible by data from the Copernicus Sentinel-5P satellite.

Developed by the European Space Agency (ESA) and launched in 2017, the British-built Sentinel-5 Precursor (Sentinel-5P) is the first satellite of the Copernicus program dedicated to monitoring air pollution, thanks to a spectrometer called Tropomi (short for Tropospheric Monitoring Instrument).

With a resolution of about 50 km2, this Dutch-built instrument can monitor atmospheric levels of aerosols, sulphur dioxide (SO2), nitrogen dioxide (NO2), carbon monoxide (CO), formaldehyde (CH2O), ozone (O3) and methane (CH4).

High-volume methane leaks

Abnormal methane concentrations in 2019 – often found in regions of the world producing or processing oil and gas. Data provided by the Copernicus program, processed by Kayrros. Image: Kayrros

You may not have heard of Tropomi yet, but it's likely you've already seen its work. Earlier this year, Copernicus Sentinel-5P produced the images that showed substantially reduced NO2 levels across China, due to the coronavirus lockdown.

Tropomi also offers the most detailed monitoring of methane emissions presently available.

Combining that data with other input from older-model Copernicus satellites Sentinel-1 and Sentinel-2, and from other sources (including ground sensors, position tracking and even social media), Kayrros scientists can identify the size, potency, and location of abnormal methane leaks around the world.

According to Kayrros, there are around 100 high-volume methane leaks active around the world at any given time.

Together, they release about 20 megatons of methane per year. About half of that volume is associated with mining for oil, gas or coal, or other heavy industries.

Together, that amount of methane per annum is equivalent to CO2 emissions of France and Germany combined.

So, how precise is the Kayrros method? Here's a recent case study.

Plume over the Permian Basin


Image: 
Kayrros


In December last year, Kayrros used data from Copernicus-5P to identify the source of a methane plume over the Permian Basin, which covers western Texas and southeastern New Mexico.

Sitting on top of a part of the Mid-Continent Oil Field, the Basin's surface is dotted with hundreds of oil wells. Yet with a little help from Sentinel-1 and Sentinel-2, Copernicus-5P managed to find the exact location, and the individual culprit.

For the first time, Kayrros tech and Copernicus-5P data make it possible to detect abnormal methane emissions in real time.

Not only will this increase the precision of methane emission estimates, it will also allow regulators to find and fine the exact culprits, and if necessary, shut down their operations.

Found: the culprit


Image: 
Kayrros


Links

(AU SMH) Climate Change Blamed For More Than A Third Of Heat-Related Deaths

Sydney Morning Herald - Peter Hannam

Human-caused global warming was responsible for thousands of heat-related deaths in recent decades, a fraction of the numbers expected in the future even if nations adopt ambitious emissions-cutting efforts.

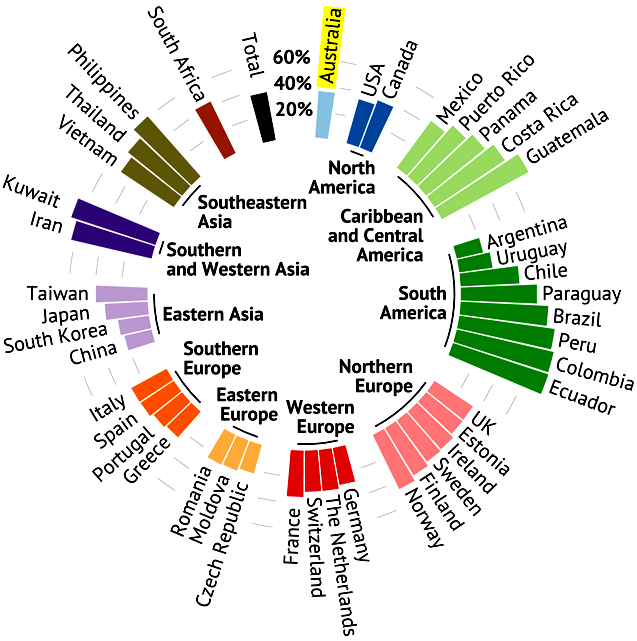
Research of 30 million deaths, spanning almost three decades in 732 locations in 42 countries, found 37 per cent of heat-related mortality could be attributed to climate change.

For Brisbane, Melbourne and Sydney, there were almost 3000 extra deaths, the international study, published on Tuesday in Nature Climate Change journal, found.

Climate change has been blamed for almost four in 10 of the heat-related deaths recorded across 43 nations over three decades. Credit: Via Weatherzone

The authors, including two based at Australian universities, applied the latest epidemiological and climate models to assess warm-season changes. The result was the largest such study of the health impacts of a hotter world to date, they said.

“We have demonstrated that health burdens from anthropogenic climate change are occurring, are geographically widespread and are non-trivial,” the paper concluded. “In many locations, the attributable mortality is already in the order of dozens to hundreds of deaths each year.”


Proportion of heat-related mortality
attributed to human-induced climate change (%)

Source: Nature Climate Change

Yuming Guo, head of Monash University’s Climate, air quality research unit, said warm-season heat-related deaths in Australia amounted to about 1.8 per cent of the total, of which about one-third can be attributed to climate change. That ratio is in line with the rest of the world, he said.

“Australians are still sensitive to heat, particularly extreme heat,” Professor Guo said. Even though residents could expect to access more air-conditioning and other relief from high temperatures, an ageing population brought extra deaths in line with other parts of the world.

Indians sit on the edge of a pond near the India Gate monument on a hot day in New Delhi when the mercury climbed to 45 degrees in May 2018. Credit: AP

For the 1991-2018 period, there were 2968 deaths in the three Australian cities that could be attributed to climate change, Professor Guo told the Herald and The Age. Sydney had the highest toll at 1484, with Melbourne at 924 and Brisbane suffering 560 extra deaths.

The fatalities would likely be proportionally higher in other parts of the country. “Normally low socio-economic areas have a higher mortality,” Professor Guo said.


Extreme weather
‘Not just dropping off a twig’: How climate impacts may be underestimated
Still, the additional deaths are occurring when average global temperatures have only increased about 1 degree since 1900.

“That rise is lower than even the strictest climate targets outlined in the Paris Agreement [to limit warming to 1.5–2 degrees] and a fraction of what may occur if emissions are left unchecked”, the researchers said.

While accounting for about 0.6 per cent of total warm-season deaths in the countries studied, the authors cautioned against extrapolating that figure globally to mean an extra 100,000 fatalities a year because many regions such as in Africa or South Asia were excluded.

Spectators try to keep cool at a sizzling day at the Australian Open in early 2019. Credit: AP

“One could expect, if warming is larger in these regions, that this percentage would be higher,” said Ana Vicedo-Cabrera, a researcher at Switzerland’s University of Bern, and the paper’s lead author.


Extreme weather
Trend towards worsening heatwaves is accelerating, new research finds
The research focused on trends rather than specific heatwaves because of data availability.

“The gap between the two scenarios [of averages and extremes] is increasing exponentially, and current adaptation may not be enough to counteract the effect of warming,” Dr Vicedo-Cabrera said.

“These findings ratify statements of scientific community that climate change is affecting human health already, it is not a matter of future generations only.

“Governments now have more reasons for urgently implementing ambitious mitigation targets and designing more efficient adaptation strategies” particularly in urban planning.

Sarah Perkins-Kirkpatrick of the University of NSW in Canberra said the results were as she expected, and there will be a lot more studies linking climate change to human health in the future.

As temperatures rise and extremes increase “more people will get sick and more people will die”, she said. “It will happen pretty much everywhere.”

Links

(USA Axios) Southwest's New Climate Peril

AxiosAndrew Freedman

Illustration: Annelise Capossela/Axios

One of the fastest-warming regions of the U.S. is the Southwest — and that region, plus the broader West, is stuck in its most expansive and intense drought of the 21st century.

Why it matters

Studies show that a warming climate is exacerbating the drought, and in some ways may be triggering it in the first place. That means the Southwest is drying out — and California's large wildfires could start as soon as next month.
  • And one climate researcher says California's Sierra Nevada Mountains saw one of the fastest snow melt-outs in history this year.
  • The drought situation is particularly severe in the Colorado River Basin and northern California. Scientists and public officials are warning that the California wildfire season is likely to be severe, due to the combination of dry vegetation and above-average temperatures.
  • This one comes on the heels of the worst fire season in state history, which turned the skies above San Francisco a "Blade Runner" orange last year.

The big picture

Some parts of the world are already getting close to, or have slipped beyond, the Paris agreement's temperature limit that scientists warned about in a report last week.
  • As Earth's temperatures tick upwards, closer to the Paris guardrail of 1.5°C (2.7°F) above preindustrial levels, some parts of the world are already warming by much greater amounts, from the Southwestern U.S. to the Arctic. These areas are seeing destructive impacts that are mounting.

Details

California's Sierra Nevada Mountains show what climate change can do as it worsens. The mountain snowpack, which provides 30% of the state's water supply annually, has vanished about two months ahead of schedule.
  • Water runoff from snow melt has been paltry, and major reservoirs like Lake Oroville are running even lower than they did during the record drought from 2012-2016.
  • Climate change is playing a key role in the drought, by boosting temperatures and increasing the loss of water to the atmosphere. Much of the snow went directly from frozen form back into the air, rather than melting into runoff.
  • Warming is also thought to be leading to increasing chances of dry fall seasons in the Golden State and shortened rainy seasons, according to Daniel Swain, a climate researcher at UCLA and the Nature Conservancy.
Craig Clements, who studies wildfires at San Jose State University, warns that large wildfires typically not seen until late summer in California could occur this year as early as June. Vegetation is at near record dry levels for this time of year, he said.
  • "We are starting off in a more dire situation than we typically would for June," Clements told Axios.

Context

The worsening drought and potentially devastating wildfire season is not an isolated occurrence for California and other Southwestern states.
  • Climate studies have consistently shown that as the world continues to warm, the Southwest will become drier and hotter. This is worrisome, given the likelihood of increased stress on water resources amid a population boom in states such as Arizona and Nevada.
  • Although it's interspersed with short intervals of wetter years, parts of the West, including California, are suffering through an emerging, human-caused "megadrought" that began in 2000.
  • Studies show this drought, measured using soil moisture data and tree rings, is the second-worst in the past 1,200 years.

What they're saying

"This current drought has quickly accelerated, and is now on par (if not worse) than the extreme and in some cases record-breaking drought that occurred just 5 years ago in California," Swain said.

What's next

If the world does not steeply reduce greenhouse gas emissions starting in this decade, more areas will warm to near or above the Paris limits, until the global average arrives at that level as well.
  • This threatens to unleash catastrophic impacts, such as the melting of parts of the Antarctic Ice Sheet.
  • For now, the drought and likely severe wildfire season in the West offer an unfortunate preview of what may come next.

Links