It is always a pleasure to be in Australia, a neighbour and a strong supporter of our young nation of Kiribati throughout its nation-building journey. The relationship between Kiribati and Australia has endured over generations and has grown from strength to strength. The relationship is predicated on shared mutual interests and being part of one region and one ocean. Even more important are the personal links that our people have nurtured and respected throughout the years and which I am confident will last.
Indeed our mutual respect for each other remains the basis for our shared interest in ensuring the preservation of this planet our one and only home. It is my very strong belief that our two nations will endeavour to do all we can to reduce greenhouse gas emissions. It is in this context that on behalf of my people, we are seeking commitments from the world's governments for a moratorium on new coal mines.
Anote Tong, President of Kiribati
The scientific evidence is clear; we need to produce and burn less coal. Furthermore, the age of coal and steam is coming to an end with the world acknowledging that there should be a transition towards cleaner and renewable energy. The moratorium on new coal mines is but the first step towards a world that is less dependent on fossil fuel. Indeed, there is simply no plausible scenario in which a world that is tackling climate change needs enormous new coal mines.
Since calling for a halt to the construction of new coal mines in August, the voices of the Kiribati people have already been joined by those of 11 other Pacific islands. Globally our call has been supported by voices as diverse as Sir Nicholas Stern and Naomi Klein. Recently in Australia, 61 eminent scientists, economists, sports people and church leaders supported our call. I take this opportunity to convey my appreciation to all of them for their support and sincerely hope that many more will be able to join this call.
We have not asked the world to cease coal production immediately. We are simply asking that the world stop building new mines. Science has confirmed that the production and use of coal is and will contribute to increasing global emissions. For my people who are at the front line of climate change, any concrete action towards the reduction of global emissions is ensuring their survival as a nation, as a culture and as a people.
It is against this background that it is disheartening to note the decision of the government of Australia to approve the Carmichael mine in Queensland. In doing so, it is basically forfeiting those of us who have the greatest to lose from the impacts of climate change, in support of relatively small and wealthy interest groups such as the coal industry.
As the Paris climate talks get closer, leaders from around the world are preparing to take part in a process which is designed to allow each of them to achieve more by working together than they could possibly achieve on their own. We can no longer act as individual nations in isolation of the rest of the world.
I am very optimistic that we as leaders will be able to act together to preserve this planet by taking positive steps towards cleaner and renewable energy. I am very confident that the world as a whole will understand that renewable energy is the only option and one that makes economic and financial sense.
Indeed, Australia is one of the leading nations in terms of technological innovation for renewable energy. Furthermore, the growing support for a moratorium on coal by the Australian public and around the world is acknowledgement that to ensure the preservation of this planet our one and only home, renewable and clean energy is the only way forward.
For the sake of our children and our grandchildren, let us do what is right for them.
Earth's oceans and land cover are doing us a favor. As people burn
fossil fuels and clear forests, only
half of the carbon dioxide released
stays in the atmosphere, warming and altering Earth's climate. The
other half is removed from the air by the planet's vegetation ecosystems
and oceans.
As carbon dioxide levels in the atmosphere continue their rapid,
man-made rise past levels not seen for hundreds of thousands of years,
NASA scientists and others are confronted with an important question for
the future of our planet: How long can this balancing act continue? And
if forests, other vegetation and the ocean cannot continue to absorb as
much or more of our carbon emissions, what does that mean for the pace
of climate change in the coming century?
These questions are a major priority for NASA's Earth science
research program, and the agency is preparing to ramp up its field
studies, satellite monitoring and computer modeling to help answer them.
Carbon is a fundamental element of life on Earth, but the increasing
amount of carbon in the atmosphere — in the form of carbon dioxide and
methane molecules — is also the primary element driving our warming
climate. Scientists are studying how carbon moves through Earth's
atmosphere, land and ocean with an array of tools, including a new
dataset of the ebbs and flows of carbon in the air.
"Today and for the past 50 to 100 years, the oceans and land
biosphere have consistently taken up about half of human emissions,"
said Dave Schimel of NASA's Jet Propulsion Laboratory, Pasadena,
California. "If that were to change, the effect of fossil emissions on
climate would also change. We don't understand that number, and we don't
know how it will change in the future."
Earth's land and ocean currently absorb about half
of all carbon dioxide emissions from the burning of fossil fuels, but
it's uncertain whether the planet can keep this up in the future. NASA's
Earth science program works to improve our understanding of how carbon
absorption and emission processes work in nature and how they could
change in a warming world with increasing levels of emissions from human
activities. Credits: NASA's Jet Propulsion Laboratory
So researchers at NASA are tackling the questions from a number of
angles. They're monitoring land, atmosphere and oceans with airborne and
satellite sensors and digging into the first results from a new
satellite observatory measuring carbon dioxide. And they're pulling all
the information we have into supercomputer simulations to understand how
our Earth responds to changes in carbon emissions.
"There are all these amazing data sets, but none of them quite give
us the entire carbon story," said Lesley Ott, an atmospheric scientist
with the Global Modeling and Assimilation Office at NASA's Goddard Space
Flight Center in Greenbelt, Maryland. "The models help us tie all the
observations together to get at how atmospheric carbon is varying and
changing, but we still have a lot of work left to do to understand how
carbon moves among the land, oceans and atmosphere."
Carbon on the move
Carbon naturally cycles through Earth's environments. Trees and other
plants take up carbon dioxide and turn it into the building blocks of
roots, stems and leaves. Some of that carbon stays in the soil as the
vegetation dies and gets buried. Some is released back into the
atmosphere as carbon dioxide through plant respiration, and both carbon
dioxide and methane — another potent, carbon-based greenhouse gas — can
be released through decomposition, land clearing and wildfire. The ocean
absorbs carbon dioxide from the atmosphere, and the tiny water-dwelling
plants called phytoplankton take up the gas as well. Over many
millennia, the pace of carbon cycling is governed by volcanic emissions
and weathering of rocks.
For most of human history, carbon has been in a more-or-less steady
cycle. This cycle has been thrown off balance as people burn fossil
fuels — carbon that has been long buried underground as oil, gas and
coal — and as forests are cleared and soils are turned for agriculture.
All of these contribute to increasing carbon emissions. While the amount
of carbon dioxide emissions that ecosystems absorb from the atmosphere
each year varies quite a bit, the fraction in the long run has averaged
out to about half.
More carbon dioxide and methane in the air means warmer global
temperatures. Warmer temperatures can disrupt some ecosystems and impact
their ability to absorb more and more carbon. An even more imbalanced
carbon cycle will cause greater variability and consequences that are
not yet fully understood.
NASA's newest tool in tackling the complex question of carbon ebbs
and flows is the Orbiting Carbon Observatory-2, or OCO-2. Launched in
July 2014, the mission measures how much carbon dioxide is in the
atmosphere near the planet's surface. With that dataset, researchers can
better begin to characterize where carbon is being emitted and absorbed
and over what timescales. Mission scientists recently analyzed OCO-2's
first year of data, and saw the expected decreases in atmospheric carbon
dioxide in the Northern Hemisphere's summer, as plants undergo
photosynthesis. They saw upticks in the greenhouse gas over power plants
and megacities, and over areas where people clear forests for
agricultural use.
"The new, exciting thing from my perspective is we have more than
100,000 measurements each day of carbon dioxide in the atmosphere," said
Annmarie Eldering, OCO-2 deputy project scientist at JPL. "Not only do
we have a lot of measurements, but they tell us a lot. We can see a
change [in atmospheric carbon] of one-quarter of 1 percent from space.
Armed now with this pile of data, we can start to investigate more fully
this question of sources and sinks and how different parts of the world
contribute to these processes."
The Orbiting Carbon Observatory-2 satellite is providing NASA's first detailed, global measurements of carbon dioxide in the atmosphere at the Earth's surface. OCO-2 recently released its first full year of data — critical to analyzing the annual cycle carbon dioxide concentrations in the atmosphere. Credits: NASA/JPL-Caltech
Plants and ocean lend a hand
Terrestrial plants — from towering Douglas firs to moss growing on
rocks — take up carbon dioxide from the atmosphere during
photosynthesis, processing it into carbon-containing leaves, stems,
branches and more.
"The land helps to mitigate something like a quarter of the carbon
dioxide emissions," said Jeffrey Masek, chief of the biospheric sciences
laboratory at NASA Goddard. "The question is: What will happen in the
future? Can we count on this to continue? Or are land processes going to
saturate, in which case we'd see our atmospheric carbon dioxide
concentration start to increase much more rapidly."
Monitoring photosynthesis is one way for scientists to study
vegetation health and growth in an atmosphere with increasing carbon
dioxide. Even though photosynthesis is a process occurring at the
microscopic scale on the land and in the ocean, scientists have found
the best way to monitor it globally is by satellite.
"If it weren't for satellites, we would have very little
understanding of the biological activity of the entire Earth," said Josh
Fisher, a climate scientist at JPL. "We know from our field studies
about how different ecosystems [vary], but we don't know how robust or
representative our studies are at the global scale."
The Landsat missions and the Moderate Resolution Imaging
Spectroradiometer (MODIS) instruments on the Terra and Aqua spacecraft
allow researchers to study the greenness of vegetation as a proxy for
photosynthesis, and therefore carbon dioxide uptake, across the globe.
Scientists are also using OCO-2 to take a big-picture look at these
small-scale processes, capturing the faint fluorescence given off by
terrestrial plants during photosynthesis, Eldering said. With
fluorescence, scientists have a new way to observe how active – or not –
these green ecosystems are.
Animation showing the 12-month cycle of all plant
life on Earth — whether on land or in the ocean. Rather than showing a
specific year, the animation shows an average yearly cycle by combining
data from many satellite instruments and averaging them over multiple
years.
Credits: NASA's Goddard Space Flight Center
Forests are one of the major carbon sinks, which are areas that
absorb large amounts of carbon dioxide from the atmosphere, storing it
for decades in trunks and roots. Satellite observations have illustrated
how green plants have expanded their territory in North America, as
warmer temperatures allow them to grow farther north. Height-measuring
instruments, like radars and lidars, add a third dimension to the land
cover information, allowing researchers to estimate how much material —
and therefore how much carbon — is stored in a forest. NASA has plans to
launch satellites as well as put a sensor on the International Space
Station (ISS) to measure this third dimension of forest structure and
improve estimates of how much carbon is stored in large forests.
NASA has targeted a variety of future field campaigns, satellites and
ISS sensors to improve our understanding of how much carbon is being
stored in terrestrial ecosystems and how this could change as patterns
of drought, fire and forest structure itself shift in a changing
climate.
More carbon in the atmosphere can act as a fertilizer and give
vegetation a boost, increasing the storage of the greenhouse gas at
least temporarily. But any increased plant growth due to more carbon
dioxide in the air can't continue forever, researchers say. Eventually,
the vegetation will run out of water or other nutrients necessary for
enhanced growth, while changes in temperature and rainfall could also
alter growing conditions. Without these essentials, vegetation can't
keep taking up increasing amounts of greenhouse gases from human-caused
emissions.
NASA scientists are working to understand if our
land and ocean can continue to absorb carbon dioxide at the current rate
– and for how long. Available to download, this infographic covers the
science behind Earth's carbon cycle, what's changing and how NASA is
studying the rise of carbon dioxide.
In some regions, forests are releasing more carbon than they're
storing. Satellite images have also documented the transition of green,
healthy forests through land clearing and events like wildfires and
insect infestations, which are increasing in drought-stressed
environments. Droughts themselves slow down the growth of vegetation,
slowing down the uptake of carbon in regions such as the Amazon. This
can flip the balance for forests and other ecosystems – from an overall
absorber of carbon to an overall emitter of the greenhouse gas. While
natural climate variability may cause such year-to-year changes,
scientists are concerned that climate change could turn forests into
sources of carbon on a regular or even annual basis.
Ocean scientists are facing similar questions about carbon. The ocean
water itself absorbs carbon dioxide from fossil fuel emissions. Doing
so, however, changes the chemistry of seawater. As surface water in the
ocean continues to warm, uptake of carbon dioxide will slow down.
Oceans also contain carbon in the form of plants and animals,
including phytoplankton — microscopic plants that take up carbon dioxide
through photosynthesis, just like their larger, land-based cousins.
Phytoplankton form the base of the ocean food web, and those that
survive being eaten by zooplankton will die, sinking to the bottom of
the ocean — taking their carbon stores with them to be decomposed.
Changes to ocean chemistry and circulation due to climate change may
alter this biological carbon pump, potentially triggering a release of
the carbon stored deep in ocean sediments.
In the North Atlantic the distribution of phytoplankton species is
changing due to warming waters, notes Carlos Del Castillo, ocean ecology
laboratory chief at Goddard. A different mix of phytoplankton species
will take up different amounts of carbon dioxide — which could result in
even further changes to the ocean's carbon cycle. "It's a cycle, which
we hope is not a vicious one," Del Castillo said.
Getting a global view
To get a more complete picture of this global carbon cycle, NASA
scientists are combining many different approaches to studying the land,
ocean and atmosphere. They use NASA's wealth of data on carbon dioxide
in the atmosphere with weather and climate models to monitor every
response of Earth processes to the increasing burden of carbon dioxide.
Animation of carbon dioxide released from two
different sources: fires (biomass burning) and massive urban centers
known as megacities. The animation covers a five day period in June
2006. The model is based on real emission data and is then set to run so
that scientists can observe how the greenhouse gas behaves once it has
been emitted.
Credits: Global Modeling and Assimilation Office, NASA's Goddard Space Flight Center
"You've got all these little individual sources of change — the
insects, the fire, agriculture expanding and other land use — all this
stuff flickering around on the ground, varying from year to year, over
decades. And then you've got these integrated observations of the
atmosphere," Masek said. "You need models that incorporate these
processes — all of them. And then if that model is reasonable, we should
be able to predict what the atmospheric carbon dioxide looks like. It's
a tough job."
With the supercomputers at NASA, scientists take in all the
information they can — from all the Earth science fields they can. They
program computer models to take all these inputs and try to determine
whether the land and oceans will keep giving people an assist.
"Ultimately the goal of all of this work is to be able to predict
what's going to happen with the carbon cycle," Ott said. "How much
carbon is going to be taken up by the land and ocean? We need to know
how that's going to change in the future."
By coming at the problem from multiple vantage points, using a range
of measurements and tools, scientists are strengthening the models to
give us a better picture of what our carbon-directed climate will look
like in the coming years and beyond.
It is hard for France’s capital to look beyond the terror attack, but the decisions taken at the UN climate change conference may in the end matter more
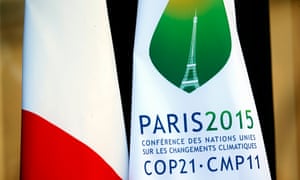
A COP21 flag at the Elysee Palace, Paris, at a pre-summit event on 10 September 2015. 'The serious negotiation in Paris will be about monitoring and enforcing compliance and setting a formula to ratchet up commitments into the future.' Photograph: Charles Platiau/Reuters
While Europe is on high alert against another murderous terrorist attack, it will be hard for Paris to look beyond the next 24 hours. But soon delegates start arriving in the French capital for preliminary meetings ahead of COP21, the United Nations climate change summit which will be launched on 30 November with all the grandeur attendant on a gathering of global leaders.
There is a certain symmetry to the two events that goes beyond the nightmare task facing France's overstretched security forces. As the UK foreign secretary Philip Hammond pointed out in an important speech in the US only days before the Paris attacks last Friday: "Unchecked climate change … could have catastrophic consequences – a rise in global temperatures … leading in turn to rising sea levels and huge movements of people fuelling conflict and instability."
There are reasons to be optimistic about a useful outcome from these negotiations, not least the determination of President Barack Obama's team to deliver a deal with some kind of legal force. But any deal will mark the start rather than the end of the process.
The world has learned from previous failures. The innovation of asking every country for its own intended nationally determined contributions in advance of COP21 is that they reduce the wriggle room, at least for the time being.
Wednesday's big speech from the UK energy secretary Amber Rudd, setting a cut-off date of 2025 for coal-fired power stations, will underline that sense of commitment and should help to build some momentum ahead of the talks, even though it is only a small advance on the policies she inherited.
It is also a necessary reaffirmation of the Conservatives' pledge to green the electricity supply which had begun to seem questionable after its widely criticised decision to end subsidies to wind and solar power unexpectedly early.
Ms Rudd said she was resetting UK energy policy and if she didn't quite do that, she did make a more or less coherent pattern from the fragments that have emerged since the election in May. It is a plan. Yet with its contradictions and conditional undertakings, it did not quite add up to a clear path through the so-called energy trilemma: the balance to be struck between security, sustainability and affordability.
Take the commitment to phase out coal over the next 10 years: it came with the caveat that it would not happen unless there was a clear and reliable alternative. Given the continuing uncertainty over new nuclear (which, in the Rudd plan, is what stands between decarbonisation of electricity supply and the lights going off), that means new gas-fired power stations – less dirty than coal, but still a finite fossil fuel.
The plan will also entail exploiting shale gas, which is so far entirely untested in the UK and already politically neuralgic. And if gas is to be the core of energy supply beyond 2030, when electricity is supposed to become carbon free, then serious money needs to go into developing carbon capture and storage. CCS merited just one mention in Ms Rudd's speech.
As for the decision to phase out subsidies for renewables, it was defended as part of a necessary move towards making green energy competitive with other fuels, even though that is something nuclear power will not be for the foreseeable future. However, there was a little good news for renewables: there will be subsidy for new offshore wind, when it can compete with the cost of new nuclear. The bad news is that although off-shore generation costs have fallen by a fifth in two years, there is still a distance to travel.
Decarbonising power supply is proving hard enough. But it poses a lesser challenge than weaning the nation off its gas-fired heating, and luring it out of its diesel- and petrol-powered cars. That puts the greatest burden of reducing carbon emissions on electricity generation.
The cheapest way to get there, the way that would make most difference to consumers and shrink their energy bills by the greatest amount, is to increase energy efficiency. Ms Rudd seems to have left that part of her plan in her pending tray.
Britain does have a positive message to deliver in Paris, and that can only be good news. But the world has not yet come up with a way of holding global warming below the critical 2C. The serious negotiation in Paris will be about monitoring and enforcing compliance and setting a formula to ratchet up commitments into the future.
For the UK, the Rudd plan, heavy on gas and light on efficiency, will make the next step in carbon emission cuts harder than it needs to be.
Australia’s bushfire preparedness is under threat from climate change as bushfire seasons here and in the Northern Hemisphere increasingly overlap, putting new demands on critical shared firefighting aircraft.
Our latest report, The Burning Issue: Climate Change and the Australian Bushfire Threat, found the length of the fire season increased by almost 19% globally between 1978 and 2013. Longer fire seasons are reducing opportunities for controlled burning and intensifying pressure on firefighting resources.
1. Record-breaking spring temperatures in 2015, exacerbated by climate change, have driven an early start to the bushfire season in Australia.
The maximum temperatures in Melbourne on October 5th and 6th were the hottest ever recorded for the first week of October while temperatures were at least 12°C above average for most of southern Australia on at least one day during that week.
Globally, seven months this year have broken their monthly temperature records and 2015 is very likely to surpass 2014 as the hottest year on record.
Longer, hotter and more intense heatwaves, and more frequent and severe droughts, are driving up the likelihood of very high bushfire risk, particularly in the southwest and southeast of Australia.
2. North America has faced a deadly bushfire season in 2015.
The North American bushfires have been driven by years of severe drought in combination with warmer temperatures, a situation Australia is likely to face with increasing frequency in future.
Between January and October of 2015, over 50,000 bushfires burned over 38,000 km2 of land – an area more than half the size of Tasmania, making it one of the worst bushfire years on record in the US.
3. Australia’s bushfire preparedness is at risk from climate change as bushfire seasons increasingly lengthen and overlap with fire seasons in the Northern Hemisphere.
Large areas of southeast and southwest Australia are facing above-average bushfire potential for the 2015/2016 summer. Most of the southeast coast of Australia is expected to experience above normal bushfire potential due to a long-term rainfall deficit, relatively low soil moisture, and relatively warm conditions predicted for the summer.
Globally, the length of the fire weather season increased by nearly 19% between 1979 and 2013. Longer fire seasons will reduce opportunities for controlled burning and increase pressure on firefighting resources.
Some of Australia’s key firefighting aircraft are leased from overseas and are contracted to North American firefighting services during their summer. The fire seasons of the two hemispheres – and the demand for these critical shared firefighting aircraft – will increasingly overlap, challenging such arrangements.
During the past decade, state fire agencies have increasingly needed to share personnel and other firefighting resources during peak demand periods. This pressure will continue to intensify and the number of professional firefighters will need to double by 2030 to meet demand.
4. Stronger climate change action is needed to reduce bushfire risk.
Australia’s emissions reduction target of 26-28% on 2005 levels by 2030 is not sufficient to protect Australians from worsening bushfires and extreme weather events.
Australia must cut emissions more rapidly and deeply to join global efforts to stabilise the world’s climate and the vast majority of Australia’s fossil fuel reserves must stay in ground.
Visualization of sea surface temperature departures from average across the Pacific Ocean, showing the hallmark signs of El Nino. Image: NOAA
The planet has not been only record warm this year, it's been so unusually mild that the temperature records themselves have set records of their own. This is the case with October 2015, according to new preliminary NASA data released Tuesday.
The information shows that October 2015 was by far the warmest October on record, dating back to 1880. Not only that, but October also had the largest temperature departure from average of any month on record.
The scorchingly hot October seals the deal: 2015 is almost certain to become the Earth’s hottest year since instrument records began in 1880. This means the year will beat out 2014, and become yet another data point showing that manmade global warming, plus natural climate variability, is pushing the climate into new territory.
Global average surface temperatures so far this year versus the other warmest years on record. Image: NOAA NCEI
Global temperature anomalies for the month of October 2015, according to NASA. Image: NASA GISSTEMP
Importantly, this was also the first time that a single month exceeded the 1-degree Celsius temperature anomaly, surpassing the 0.97 degree Celsius temperature anomaly in January 2007. This is a symbolic milestone, but one that will be broken more frequently as the climate continues to warm due to increasing amounts of greenhouse gases in the air because of human activities.
The NASA data corroborates information released by the Japan Meteorological Agency (JMA) on Monday, also showing that October was the warmest such month on record, as the year heads toward setting a record for the warmest calendar year, beating out 2014 for the top spot.
On Wednesday, the National Oceanic and Atmospheric Administration (NOAA) released its October temperature data, and also found the month was the warmest such month on record, and broke the record for the largest monthly global temperature anomaly in 1,630 months of record-keeping. The agency said the month fell just short of the 1 degree Celsius anomaly, at 0.98 degrees Celsius above average, but nevertheless solidly beat the previous record monthly temperature anomaly, which was set in September.
According to NOAA, 2015 is cruising toward the record for the planet's warmest year since instrument records began.
Parts of South America, the Atlantic Ocean, Indian Ocean, Africa, Europe, Australia, the Pacific Ocean and the western U.S. were all record warm in October, according to the NOAA data.
In the JMA data set, which analyzes similar temperature records but processes them differently than NOAA and NASA do, this October beat October 2014 by 0.34 degrees Fahrenheit, or 0.19 degrees Celsius. According to NASA, though, this October beat October of last year by 0.32 degrees Fahrenheit, or 0.19 degrees Celsius.
According to the JMA, this was the largest temperature departure from average for any month so far this year.
The JMA information shows October was unusually mild throughout areas of the Northeast, Central, and South Pacific Ocean, the Indian Ocean, much of North America, parts of Asia, and most of Europe — as well as all of Australia, Africa and the Middle East.
The warmth in the Central Pacific is related to a strong El Niño event that is characterized by unusually mild ocean temperatures along the equator, from the central Pacific to the west coast of South America.
Global average surface temperature anomalies through October 2015, showing where 2015 as a whole is likely to end up. Image: NASA GISSTEMP
El Niño events cause changes in weather patterns around the world by altering the way heat is distributed throughout the oceans and atmosphere. They also tend to boost global average temperatures higher, in addition to the effects of long-term manmade global warming.
The NOAA has found a 97% chance that 2015 will break the all-time calendar year temperature record for the planet. On Tuesday, Gavin Schmidt, who directs NASA's Goddard Institute of Space Studies in New York, said it is now 99% likely that 2015 will set a calendar year temperature record.
According to NASA, the January through October period ranks as the warmest such period in its 136 years of record-keeping, with a temperature anomaly of 0.82 degrees Celsius, or 1.45 degrees Fahrenheit. This beats global average temperature anomalies for the same period last year, which was 0.76 degrees Celsius, or 1.37 degrees Fahrenheit above average.
For the year as a whole, global average surface temperatures are likely to reach 1 degree Celsius, or 1.8 degrees Fahrenheit, above preindustrial temperatures for the first time, according to the UK Met Office, NOAA and now NASA as well.
Even 2014, which was the previous record-holder for the warmest year in recorded history, did not eclipse this symbolic, but important, boundary.
Global average surface temperature anomalies for the warmest years in NASA's data set. Image: NASA GISS
The 1-degree mark means that the world is already halfway to the internationally agreed warming target of 2 degrees Celsius (3.6 degrees Fahrenheit), above preindustrial levels. Since the stated goal of the Paris Climate Summit, which kicks off on Nov. 30, is to craft an agreement that will limit global warming to the 2-degree target or lower, it's clear that diplomats do not have an easy task before them.
In fact, the assessments produced to date show the planet will likely exceed the 2-degree threshold, at least for a period of time, even if the Paris agreement puts stringent emissions limits in place that are rigorously enforced.
The potential future effects of global climate change include more
frequent wildfires, longer periods of drought in some regions and an
increase in the number, duration and intensity of tropical storms.
Credit: Left - Mellimage/Shutterstock.com, center - Montree
Hanlue/Shutterstock.com.
Global climate change has already had observable effects on the environment. Glaciers have shrunk, ice on rivers and lakes is breaking up earlier, plant and animal ranges have shifted and trees are flowering sooner.
Effects that scientists had predicted in the past would result from global climate change are now occurring: loss of sea ice, accelerated sea level rise and longer, more intense heat waves. Taken as a whole, the range of published evidence indicates that the net damage costs of climate change are likely to be significant and to increase over time.
- Intergovernmental Panel on Climate Change
Scientists have high confidence that global temperatures will continue to rise for decades to come, largely due to greenhouse gases produced by human activities. The Intergovernmental Panel on Climate Change (IPCC), which includes more than 1,300 scientists from the United States and other countries, forecasts a temperature rise of 2.5 to 10 degrees Fahrenheit over the next century.
According to the IPCC, the extent of climate change effects on individual regions will vary over time and with the ability of different societal and environmental systems to mitigate or adapt to change.
The IPCC predicts that increases in global mean temperature of less than 1.8 to 5.4 degrees Fahrenheit (1 to 3 degrees Celsius) above 1990 levels will produce beneficial impacts in some regions and harmful ones in others. Net annual costs will increase over time as global temperatures increase.
"Taken as a whole," the IPCC states, "the range of published evidence indicates that the net damage costs of climate change are likely to be significant and to increase over time."
Future effects
Some of the long-term effects of global climate change in the United States are as follows, according to the Third National Climate Assessment Report:
Change will continue through this century and beyond
Global climate is projected to continue to change over this century and beyond. The magnitude of climate change beyond the next few decades depends primarily on the amount of heat-trapping gases emitted globally, and how sensitive the Earth’s climate is to those emissions.
Climate Time Machine
Go backward and forward in time with this interactive visualization that illustrates how the Earth's climate has changed in recent history.
Temperatures will continue to rise
Because human-induced warming is superimposed on a naturally varying climate, the temperature rise has not been, and will not be, uniform or smooth across the country or over time.
Frost-free season (and growing season) will lengthen
The length of the frost-free season (and the corresponding growing season) has been increasing nationally since the 1980s, with the largest increases occurring in the western United States, affecting ecosystems and agriculture. Across the United States, the growing season is projected to continue to lengthen.
In a future in which heat-trapping gas emissions continue to grow, increases of a month or more in the lengths of the frost-free and growing seasons are projected across most of the U.S. by the end of the century, with slightly smaller increases in the northern Great Plains. The largest increases in the frost-free season (more than eight weeks) are projected for the western U.S., particularly in high elevation and coastal areas. The increases will be considerably smaller if heat-trapping gas emissions are reduced.
Visualization comparing 1950s and 1920s
This NASA visualization presents observational evidence that the growing season (climatological spring) is occurring earlier in the Northern Hemisphere.
Changes in precipitation patterns
Average U.S. precipitation has
increased since 1900, but some areas have had increases greater than the
national average, and some areas have had decreases. More winter and
spring precipitation is projected for the northern United States, and
less for the Southwest, over this century. Projections of future climate over
the U.S. suggest that the recent trend towards increased heavy
precipitation events will continue. This trend is projected to occur
even in regions where total precipitation is expected to decrease, such
as the Southwest.
NASA visualizations of future precipitation scenarios
These NASA visualizations show model projections of the precipitation changes from 2000 to 2100 as a percentage difference between the 30-year precipitation averages and the 1970-1999 average.
Precipitation Measurement Missions
The official website for NASA's fleet of Earth science missions that study rainfall and other types precipitation around the globe.
Precipitation quiz
Earth’s water is stored in ice and snow, lakes and rivers, the atmosphere and the oceans. How much do you know about Earth's water cycle and the crucial role it plays in our climate?
More droughts and heat waves
Droughts in the Southwest and heat waves (periods of abnormally hot weather lasting days to weeks) everywhere are projected to become more intense, and cold waves less intense everywhere.
Summer temperatures are projected to continue rising, and a reduction of soil moisture, which exacerbates heat waves, is projected for much of the western and central U.S. in summer.
By the end of this century, what have been once-in-20-year extreme heat days (one-day events) are projected to occur every two or three years over most of the nation.
NASA visualizations of future precipitation scenarios
These NASA visualizations show model projections of the precipitation changes from 2000 to 2100 as a percentage difference between the 30-year precipitation averages and the 1970-1999 average.
Droughts in the Southwest and Central Plains of the United States in the second half of the 21st century could be drier and longer than anything humans have seen in those regions in the last 1,000 years, according to a NASA study published in Science Advances on February 12, 2015.
Hurricanes will become stronger and more intense
The intensity, frequency and duration of North Atlantic hurricanes, as well as the frequency of the strongest (Category 4 and 5) hurricanes, have all increased since the early 1980s. The relative contributions of human and natural causes to these increases are still uncertain. Hurricane-associated storm intensity and rainfall rates are projected to increase as the climate continues to warm.
According to a new NASA study, a string of nine years without a major hurricane landfall in the U.S. is Iikely to come along only once every 177 years. This video explains the findings of this study.
Sea level will rise 1-4 feet by 2100
Global sea level has risen by about 8 inches since reliable record keeping began in 1880. It is projected to rise another 1 to 4 feet by 2100. This is the result of added water from melting land ice and the expansion of seawater as it warms.
In the next several decades, storm surges and high tides could combine with sea level rise and land subsidence to further increase flooding in many of these regions. Sea level rise will not stop in 2100 because the oceans take a very long time to respond to warmer conditions at the Earth’s surface. Ocean waters will therefore continue to warm and sea level will continue to rise for many centuries at rates equal to or higher than that of the current century.
Sea level quiz
Test your knowledge of sea level rise and its effect on global populations.
Arctic likely to become ice-free
The Arctic Ocean is expected to become essentially ice free in summer before mid-century.
Earth’s vital signs: Sea ice
An indicator of changes in the Arctic sea ice minimum over time. Arctic sea ice extent both affects and is affected by global climate change.
Global Ice Viewer
An interactive exploration of how global warming is affecting sea ice, glaciers and continental ice sheets worldwide.
The
El Niño event of 2015-2016 is making history, wreaking weather havoc
around the world and forecast to unleash many weather surprises through
the coming winter.
As of today, the warm ocean temperatures that
define El Niño have surged to a stunning three degrees Celsius (5.4
degrees Fahrenheit) warmer than normal in the central tropical Pacific,
the highest level ever measured.
Anomaly for El NIño 3.4 region spikes at record +3.0
Many global impacts already
El
Niño events, while simply descriptions of ocean temperatures in the
tropical Pacific and not storms, have ripple effects on weather patterns
all over the world.
“Severe droughts and devastating flooding
being experienced throughout the tropics and sub-tropical zones bear the
hallmarks of this El Niño, which is the strongest for more than 15
years,” said World Meteorological Organization (WMO) Secretary-General
Michel Jarraud in a news release.
According
to the World Meteorological Organization, the El Niño of 2015-2016 is
shaping up to be one of the strongest in this past century. Here are the
types of weather we can expect around the world due to this year's El
Niño. (World Meteorological Organization/ YouTube)
The WMO published a long list
of many harmful weather impacts for which this El Niño has been
implicated, including coral bleaching and the most active season for
intense tropical cyclones in the Northern Hemisphere on record, both due
to historically warm ocean waters. [The Northern Hemisphere’s record-shattering tropical cyclone season, by the numbers]
It
also linked El Niño with drought in South East, Asia which has lead to
one of the worst wildfire outbreaks in Indonesia on record. [Indonesian fires are pouring huge amounts of carbon into the atmosphere]
Not
all impacts from El Niño have been harmful. For example, it introduced
wind shear in the tropical Atlantic which has depressed hurricane
activity that might impact North America and may already be increasing
precipitation in California, which is suffering from a historic drought. [Is the near-record El Niño already chipping away at the California, western drought?] ‘Uncharted territory’
This El Niño is operating in a warmer world in which forecasters have no prior experience predicting its effects.
“This
event is playing out in uncharted territory,” Jarraud said. “Our planet
has altered dramatically because of climate change, the general trend
towards a warmer global ocean, the loss of Arctic sea ice and of over a
million square kilometers of summer snow cover in the northern
hemisphere.”
“So
this naturally occurring El Niño event and human induced climate change
may interact and modify each other in ways which we have never before
experienced,” he said.
“Even before the onset of El Niño, global
average surface temperatures had reached new records. El Niño is turning
up the heat even further,” Jarraud added.
While El Niño has certain characteristic effects which we have discussed at length in the past (for the D.C. area, and the U.S. and beyond), the background warmth adds a potential element of surprise heading into the winter months. Comparing this year’s El Niño vs. 1997-1998, and what it portends
While
today’s unsurpassed ocean temperature measurement in the central
tropical Pacific made history, it is too soon to know if this toasty
temperature reading is just a blip or a signal. In order for this El
Niño to officially pass 1997-1998’s event as the strongest on record,
the warm waters would need to be sustained near these level for three
months.
3.0C in Nino 3.4 using OISSTv2 is the highest on record.
“A
week of sea surface temperature-only data isn’t enough to say this is a
record,” said NOAA climate analyst Michelle L’Heureux in an email.
Forecasters
expect strong El Niño levels to persist through the winter, but it may
be peaking now and about to begin a gradual decay. However, the event’s
recent and projected intensity may be enough for this event to surpass
1997-1998.
“Judging from the trajectory of SST anomalies … it is
likely that one of the late-year three-month average … sea surface
temperature values in 2015 will end up upending 1997’s record warmth and
claim for the 2015 the title as strongest El Niño event on record,” wrote Weather Underground meteorologist Jeff Masters.
Every
El Niño has its own signature and, so far, what sets this one apart is
the amount of warm water it has generated across a vast expanse of the
Pacific – spanning both the eastern and central part of the ocean basin.
While it hasn’t been as intense in the eastern tropical Pacific as
1997-1998, its warm waters have extended farther west.
Compare and contrast: Weekly SST anomalies for this week in 1982, 1997, and 2015.
“So,
in terms of the eastern Pacific, this event is weaker than 1997, but in
terms of the central Pacific, the present event is stronger,” said Paul
Roundy, a professor of atmospheric science at the University of Albany.
Phil
Klotzbach, a tropical weather researcher from Colorado State
University, says a powerful eastward push of water known as a Kelvin
wave may lead to some warming in the eastern Pacific over the next few
weeks.
The implications of warm water covering such a vast area of the Pacific in terms of weather patterns in the U.S. are unclear.
Sometimes
El Niño events which have their warmest waters in the central rather
than eastern Pacific favor less precipitation in California and colder
conditions in the Northeast U.S. than events with warmer water to the
east. But researchers aren’t convinced this event will behave like a
central Pacific El Niño, sometimes described as a Modoki event.
“Although
it has large sea surface temperature anomalies across the central
basin, it is NOT a central Pacific El Niño event,” Roundy said. “The
present circulation response pattern and model forecasts agree that
circulation outcomes are likely to be more like strong east Pacific
events, because convection is aligned well east of the dateline.”
Klotzbach
along with two climate researchers at NOAA’s Climate Prediction Center,
Jon Gottschalck and Stephen Baxter, said they agreed with Roundy’s view
via email.
Jason Furtado, a professor of meteorology at the
University of Oklahoma, said while he concurred this El Niño is not a
central Pacific event, the very warm waters observed there might mean
the winter bears some of its characteristics. Furtado also cautioned El
Niño “is but one ingredient for our winter climate – its interactions
with other processes and climate patterns will also be important to
monitor.”