21/10/2016

Exposed: The Climate Fallacy of 2100

Scientific American - Robert Wilder | Daniel M. Kammen

If we do not plan, now, to limit carbon emissions beyond this century, we will foolishly raise the oceans dramatically for thousands of years
Credit: BRAD GREENLEE Flickr, CC BY 2.0
It’s shocking for me (Robert) to accept that my home could be wiped out by greatly rising seas. That’s because I live on a hill north of San Diego, 45 feet above sea level and more than a mile inland from the coast. Equally shocking to me (Dan) is that the current coastline of my beloved Mendocino County, California, could largely disappear, a place where I spend weekends with my daughters exploring rivers that run inland, deep into wine country. These inundations won’t happen this century, but that is little solace. At the rate the world is going, land so dear to our hearts could slip under the sea and stay there for thousands of years.
That hurts. Most of us believe our homes, our towns, our cities will be here for centuries and millennia to come. And why not? In Europe and across Asia millions of people live in cities that are thousands of years old. Indeed, inspired by European permanence, Robert’s family built garden walls from stone and fondly looked forward to passing on the land to hoped-for-grandchildren, and theirs, and so on.
That idea, however, now seems flawed to both of us writing this article. Strong, new research indicates that anyone or anything tens of feet above the sea today may one day face an unbeatable force, whether a country home near San Diego or a skyscraping condo in Miami. Although shorelines are forever evolving, these changes can be predicted directly, and are due to needlessly excessive carbon dioxide (CO2) emissions from a relatively brief, recent period of time.
How has the public not been made clearly and painfully aware of this? Why does fierce debate over climate miss so glaring a threat? The misperception, the widespread disbelief and the fallacy are rooted in a grave error in our thinking about time.

An Artificial Horizon
The many models that have projected scenarios about future climate change generally forecast only to the year 2100, or at times merely to 2050. As a result, public discussions have been mostly about “X degrees of warming” or “Y feet of sea level rise” to the end of this century. We have accidentally but notably limited our thinking, causing us to miss striking impacts that arise beyond this limited and artificial, specific time horizon.
It is fair to say that citizens and politicians intend for Miami, and indeed the whole State of Florida, to exist well beyond 2100. Same for New York City, Boston, Washington D.C., London, Shanghai, Amsterdam, Mumbai and so on. Yet the same people discount staggering losses these places face beyond 2100. That’s wrong, and immoral too.
That’s because a crucial fraction of airborne carbon from the industrial revolution, plus that coming this century and next, will persist for tens to hundreds of thousands of years. The CO2 stemming from just 150 years ago to a mere two centuries ahead may commit the world by inertia to tens of thousands of years of impacts.
Anything going on for tens of thousands of years ahead essentially means “forever” on human time scales. These new data imply that we’re creating a kind of forever legacy, one that potentially can’t be ever forgotten, or fixed, no matter how far ahead we conceive of humanity.
We are doing ourselves a dreadful disservice by consistently framing 2100 as essentially the last, final year of impacts. We’re thinking in a blinkered way decades out, while our foot is pressing hard on a warming accelerator that has serious impacts centuries out.
How, then, can we think about climate and seas in truer time frames?
An admirable new paper by Peter Clark and colleagues in Nature Climate Change, titled “Consequences of Twenty-First-Century Policy for Multi-Millennial Climate and Sea-Level Change,” illuminates the issue and helps point a way ahead. It addresses sea level rise in a longer term from a scientific perspective.
The authors first analyze data that show how a major rise in CO2 and warming from 20 millennia ago brought Earth out of an ice age. Air temperatures continued to rise over a long period from the Ice Age to the near-modern climate that began some 11 millennia ago. From that time onward, CO2 levels and air temperatures sharply leveled off.
Sea levels, which were 400 feet lower than today, did not stop rising, however. They continued rising long past when air temperatures reached their plateau, rising for another 8,000 years, climbing another 150 feet up to today’s height. The oceans did not achieve the near-current state that we all know as modern coasts and maps until roughly 3,000 years ago.
The mere sliver (in geologic time) of climate stability in the last 10 or so millennia has dearly helped human societies and cultures to flourish. But the lesson is that seas are acutely sensitive to CO2 and temperatures, and they can have inertia lagging the carbon cycle and climate system. That means today’s oceans could go on rising very long after CO2 might be steadied—even if humanity takes determined action to slow rises in CO2 worldwide, or even decrease emissions. This thorny fact is not widely appreciated.
As Clark and his co-authors note, one-fifth to half of the airborne CO2 released by human industry so far and in the next 100 years will still be present in the atmosphere by the year 3000. Combine CO2 persistence with the inertia of seas and it can mean sea level rise might go on at least 10 or more millennia—the unimaginable. There is no easy off switch to halt the rising of seas, no matter how much future societies might wish it to end.
The opportunity to go on ignoring this basic dynamic is now vanishingly small. There’s already been a well-accepted 1.5 degree Fahrenheit increase in global temperatures since 1900. That change alone seems to come close to the greatest variations that have occurred over the previous 10,000 years.
The current rate of change is just as concerning. It had taken a long period, from some 21 millennia to 12 millennia ago, for atmospheric concentrations of CO2 to jump by 80 parts per million (ppm), from about 190 to 270 ppm. In that time span global temperatures rose by an average of 7 degrees F. We are on track to repeat that kind of increase over a much shorter period.
Keep in mind what that scale of change means. A difference of 7 degrees F separates today’s “ideal” climate from the extreme conditions of an ice age. For a refresher, the Ice Age built ice sheets over Canada, New England, parts of the Midwestern U.S., Northern Europe and Northern Asia. The Great Lakes were born when those sheets retreated. The meltwater retreat created Long Island in New York, and Cape Cod. Huge impacts were thus wrought by 7 degrees F; ice stood two miles tall over parts of North America, and shaped the elevations of a continent we know today.
Just imagine if there’s another 7 degrees F of global warming ahead. Certainly that would alter land, sea and ecology in scales and ways hard to fathom.
By looking back to Earth’s more distant past we know that with a temperature rise of “only” 2 degrees to 5 degrees F warmer, seas could rise 15 to 65 feet, a level that would drown so much today. For a thought experiment, adding 5 degrees F of warming is very imaginable, given current trends of increasing CO2. So it is reasonable to imagine seas 60 feet higher. That would render all of Florida a memory, almost all of New York City, much of the Eastern seaboard, parts of the Western U.S. and Gulf Coasts—and (Robert’s) acre of San Diego land that today is a mile from the present shore.
Mechanisms by which this happens are easy to fathom. Greenland’s ice sheet stores only 22 feet of potential sea level rise, possibly ongoing for some 10 millennia. However, the Antarctic ice sheet stores around 150 feet of potential rise in that same time frame. Ironically, over the last dozen years, the East section of the Antarctic ice sheet annually has gained some 175 trillion pounds of ice. But West Antarctic annually has lost much more, some 275 trillion pounds of ice. (Greenland has averaged 600 trillion pounds of ice lost yearly, which is equivalent to10 billion trucks a year carting ice away).
We may be heading quite outside of conditions known in human recorded history. Earth might even begin to exhibit changes of states that only can be guessed at. A new study, for instance, shows that net melting is causing Earth to slightly change how it moves on its polar axis. Days are getting just very slightly longer as ice melts at poles and redistributes that mass as water towards the equator. A very tiny change in Earth’s spin may not be troubling, yet it helps to show the magnitude of changes possible from CO2. Even distant earthquakes conceivably can grow in size or frequency, as unburdening crust rebounds after losing trillions of tons of ice. That in turn also could mean increased volcanism and tsunamis worldwide.
These threats may be on long timescales but there’s an acute need for scientific knowledge, measured in and across millennia, to seep into our global discussions.
August 2016 was the planet’s warmest month on record, by a lot. It was the 16th month in a row that a monthly heat record fell, way beyond any such streak in 137 years of record keeping. Arctic temperatures were an eye-opening 20 degrees F above normal. With relatively extreme levels of heat covering the Arctic, ice levels in the winter there were the lowest ever recorded. Nights have stayed warmer worldwide, too, making heat waves tougher to endure. This happened alongside the largest, single-year jump in atmospheric CO2 concentrations ever recorded. The level is now over 400 ppm and rising. And the global ocean reached record warmth as well.
So what does all this mean for sea level rise?
An international panel in 2013 had given scenarios for rise in this century mainly based on straightforward expansion of warming oceans. They only allowed for a small influence from marine ice-sheet instability, known as MISI, primarily on the assumption that Antarctic ice sheets were too stable and vast to irreversibly shrink this century.
The report presented an optimistic lower-end CO2 scenario that assumed strong actions would be taken later this century to reduce CO2 emissions, and which predicted an estimated 1 foot of rise (0.3 to 0.6 meters) by 2100. The higher-end estimate, based on current trends continuing and little strong action this century to reduce CO2, led to 3 feet of rise by 2100, with the rate increasing rapidly to between one third to over half of an inch (8 to 16 millimeters) per year during the last two decades of this century. Such a rate only a century hence could be up to 10 times the 20th century average rise and might possibly approach what had occurred around end of the Ice Age, when seas rose rapidly.
In the three years since that major report, three new papers on ice-sheet dynamics have shown that our prior understanding was incomplete, and that MISI mechanisms may be much more extensive across the Antarctic. The enormous Pine Island Glacier in Antarctica, for example, is thinning and retreating at a quickening rate. Mechanisms in newer models show that mass loss from unstable retreat may potentially become significant, sooner than expected. Some early collapse may be starting at the Thwaites Glacier now. Unexpected collapse of the Antarctic marine ice sheet could cause previous upper estimates of sea level rise to be exceeded not long after the end of this century. Although the timescale is uncertain, more rapid collapse could occur in a relatively short time period of two to nine centuries.
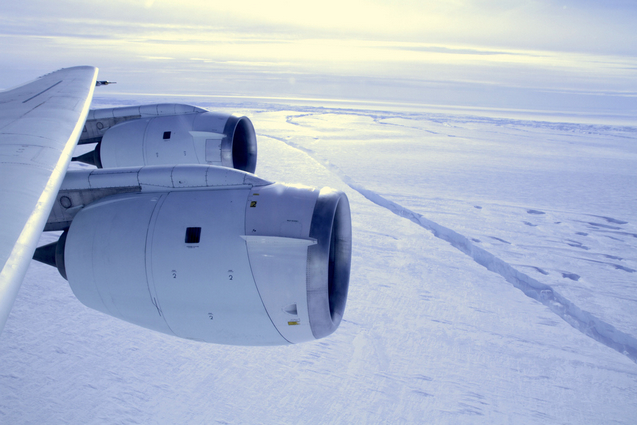
NASA’s DC-8 flies over the crack forming across the Pine Island Glacier ice shelf on Oct. 26, 2011. Credit: NASA GODDARD SPACE FLIGHT CENTER, Flickr, CC BY 2.0
Furthermore, an important paper released in 2016 notes marine ice cliffs may be becoming instable, another mechanism for yet more rapid retreat through 2100. A different paper, out in March, shows sea levels could start to rise much more than was forecast in the prior lower-end scenarios. It indicates that more than 40 feet of rise may potentially come just from Antarctica by 2500, in accord with higher-end scenarios for CO2.
The point here is that 2100 shouldn’t be regarded as a terminal year. To do so is folly, a fallacy in thinking. Life goes on, people do not end there, and seas will not suddenly halt their rise then.
Scientists are natural skeptics, not prone to dramatize their findings. But cause for abundant hope is fading. That ought to stretch our thinking. Listening to the sea and this emerging science should mean adjusting ideas about what’s wise. The paleoclimate record indicates that in periods of meltwater, or termination of the last glacial period, seas possibly might have risen at an astounding rate of a foot per decade, or 10 feet per century. There is no reason to say it can’t happen again, or rise by faster rates. Given aggressive CO2 trends, it must be considered.
Will such ideas lead to sound policy decisions? They should, but probably will not. Consider that likely levels of CO2 could make a folly of putting billions or trillions of dollars into armoring coastlines. One can imagine an enormously long and expensive wall, say 10 feet high, being topped in a century or two. And one can’t even imagine seawalls able to handle oceans going 50 feet higher and rising.
Costly walls might make slightly more sense if rising seas could be counted on to stabilize, or retreat from knowable heights, and do so in a year meaningful to our species. Since neither is the case, capital that might be spent on armoring might instead be deployed in smarter ways. Arguably, rather than spending enormous yet finite capital on costly “hardening,” it would be better to put resources into avoiding CO2 emissions, and growing renewable energy in the first place. Prevention rather than cure. That brings up the next part of this story: What, then, should we do?

Global Climate Policy: Where’s the Action?
One recently celebrated initial step was the Paris climate agreement, spelled out in December 2015. Although pundits thought it would take years to ratify the accord, by October 2016 the needed threshold of 55 nations that also represented 55 percent of global emissions had ratified it, putting it into effect.
Moving from hope to real and difficult action has undermined prior aspirational agreements, however, such as the Kyoto Protocol. Paris is an important start, as is a recent amendment expanding the Montreal Protocol to cover hydrofluorocarbons, but the world is critically short on time and the means to verify reductions, and on finance for the necessary actions to achieve those reductions.
Paris, moreover, isn’t binding. It is no treaty, and it lacks penalties. And perhaps most importantly the formal goal of 2 degrees Celsius (3.6 degrees F) for an “upper limit” on “allowable” warming is in truth a legal fiction, a mere balm for present leaders, since the planet is on a clear path to blow right past it.
Furthermore, science suggests this 2 degrees C of warming is far more dangerous than the negotiators seem to think. Warming with much higher seas for millennia can be already baked in, even at a hoped-for 2 degrees. That is why the Paris Accord left many scientists shaking their heads in despair. There is an enormous gap between how quickly the science says carbon emissions must fall to stay within 2 degrees C, and what global agreements like that from Paris may aim to require.
International equity is important, too. Western nations have already burned through much of the world’s total allowable carbon budget—the amount of carbon the world can burn before the planet is likely to cross the 2-degree threshold. This is profound, and vexing. Developing nations like China and India bear little blame for fuels burned for a century till now, and they may unsurprisingly argue for growth based on carbon-spewing industry of their own.
Yet repeating our same carbon-path is now unaffordable given the global carbon budget. The physical carbon ceiling is wholly unyielding. The chemistry and physics of warming can’t be bargained with or pled to. Therefore, although the Paris climate accord is good as a first step, the need now is for ongoing real action and a strong, continuing commitment to progress to a 1.5 C target. If we act as if Paris and the Montreal Protocol amendment are the major endpoints, not a beginning, that will put off real solutions until it is too late.
There are also pitfalls along the way if we don’t make climate solutions an ongoing process. “Cap-and-trade” systems for carbon emissions in theory can begin a transition to market-based mechanisms but they have already been gamed by many participants because caps are not rigorous and diminishing. A very hard look is needed at how natural gas is implemented: Can a plant be built today and be decommissioned by 2050? So-called “clean coal” is expensive, untested, unwieldy and unworkable, yet it is raised as a panacea. (Lost coal jobs are indeed a concern worthy of much attention, however). Nonstarters like geoengineering are suggested in some desperation, at least in the long term, yet they defy morality and could worsen a spiraling ocean acidification.
Today, opportunity lies in implementing clean, green economies of solar and wind power, and energy efficiency, and geothermal and hydropower when ecologically friendly. The challenges of ocean acidification, fragile ecosystems and climate-induced migration all point to the need to scale up the truly clean energy economy at an exceptional pace.
We suppose that possibly we all could close our eyes and hope that, say, leaders in China go even bigger on clean energy while dropping coal entirely. But China is cutting back on its ambitious solar goals.
We could hope for “negative emissions” by sucking CO2 from the air and sequestering it into stone far below ground. That's technically feasible in certain basaltic rock regions, but the process is extremely expensive, and it is difficult to see this being implemented at a global scale. And that is where the rub is: CO2 dumping is free, today, and CO2 sequestration is costly.
There are steps that make sense. Carbon taxes—including revenue neutral ones where other taxes are reduced—can work because they send unambiguous economy-wide signals. Carbon accounting across the public sector, and for companies wishing to do business with local to national governments, can educate and start the movement to full carbon pricing. Strong crossover policies, such as those linking car purchases to low-carbon goals, also accelerate the process.  Financial divestment from fossil fuels—which has been a challenge to implement—is another natural place to begin.
We must consider, then, opportunities that harness viable technology and economics. For example, a simple, transparent carbon tax could be key. It could help get us near where we’ve got to be and hasten green energy. Even many big businesses are now calling for a carbon tax. A simple tax that’s adopted widely could be very significant. But in the U.S. a carbon tax goes unmentioned in political debates.
One way or another, if leaders are going to get real on climate, they have to end fossil fuel subsidies, then phase out fossil fuel use, all while implementing clean, renewable energy for electricity generation and transportation. We should do this for our grandchildren and for their grandchildren. And because it is patriotic, will make us stronger and is far less distorting to our interests than fossil fuel dependence.
These moves are not burdens. They are opportunities. Getting closer to 100 percent renewables could be achieved more readily than most people say. It can make nations stronger and more resilient, and add jobs. In some places like California, China, Denmark, Germany, Kenya and Morocco, renewable energy is progressing faster than in others. But nowhere is it fast enough.
We two authors have spent most of our careers advancing renewable energy and sustainability, addressing climate both in theory and practice around the world—in academia, the public sector, the private sector and as entrepreneurs. Yet nothing currently gives us great hope that very harsh scenarios for climate change and sea level rise, lasting for millennia, will be completely avoided.
Looking at rates of CO2 emissions, and at international actions that lean toward lofty words about future cuts over real action with teeth today, optimism does not spring to mind. In a mere couple of centuries, humans will have committed Earth to new climate regimes and higher seas never seen in our history, that will potentially last millennia.
And we will have done it all, knowing the likely consequences.

Links

The Ocean Cannot Absorb Much More CO2

INSEAD - Robert Ayres*

Most carbon emissions are absorbed by the ocean, but it's running out of capacity, which could make global temperatures rise even faster. Australia's Great Barrier Reef, a 25 million-year-old ecosystem and home to 1,625 species of fish, is on life support. Reports suggest about 93 percent of the reef has succumbed to bleaching, largely the result of climate change.
Spanning 1,400 miles, larger than the United Kingdom, the reef could soon become extinct. Bleaching is the result of increased acidity due to CO2 entering the oceans from the environment. Currently, it is estimated that 57 percent of new emissions are "dissolved" in the oceans. Moreover, (thanks to warming) the ocean keeps less carbon dioxide in solution. A warmer ocean will dissolve progressively less CO2, thus keeping more of the excess CO2 in the atmosphere. This "carbon-cycle feedback" has different consequences in different general circulation models, ranging from 0.1°C to 1.5°C in increased global temperatures.
As I've pointed out in two previous articles, the true effect of CO2 is fiercely debated and some climate deniers even go so far as to suggest that an increase in emissions is good for the environment, that crop yields will increase as a result of photosynthesis. But ever-improving science tells us that things aren't that simple, especially when it comes to the oceans. So, to finish this series by looking yet again at the evidence, I demonstrate the effect of climate change on the oceans and the implications of this effect.
We know three things about the oceans with certainty:
  1. The ocean is warming.
  2. The sea level is rising.
  3. The ocean is acidifying due to CO2 absorption (which interferes with calcification in organisms, from coral reefs and shellfish to fish bones).
The ocean tells the story
How do we know? First, thanks to the Argo programme, we have increased our coverage of ocean temperatures, from surface to 2,000 meters below surface. With 4,000 floating sensors around the world, we know for certain that the temperature of the oceans is rising as seen below, which confirms historical (albeit more primitive) data.

Second, sea levels have been rising by about 1.7 mm/year since 1901 and about 3.2 mm per year since 1993. The heating of the oceans is accelerating along with CO2 and temperature increases in the environment. The two main reasons are more water from melting glacier ice on land and from groundwater and thermal expansion due to ocean warming.
Third, we can see ocean acidification in the near death of the Great Barrier Reef and other underwater ecosystems. About 30 percent of the excess carbon dioxide from human activity (fossil fuel combustion) is dissolved in the oceans. It is known that this produces carbonic acid, which subsequently reacts with calcium ions to form bi-carbonate, making it less available to calcification in organisms, such as coral.

Taking one for the team
This is troubling because the ocean has a tendency to reinforce these effects due to its nature. It is important to realise that the oceans are by far the main storage system for heat in the short to medium term, having absorbed 93 percent of the increase in global heating between 1971 and 2010 (IPCC 2014). Oceans can absorb or emit heat much faster than solid rock, and can store much more (1000 times as much) than the atmosphere. Hence the effective heat storage capacity of the top 700 meters of the oceans, which exhibits measurable seasonal variation, is much larger than the heat storage capacity of either the atmosphere or the land. This is because thermal conductivity of the ground is very low and vertical convection through the crust is almost zero (except during volcanic eruptions), while the mass of the atmosphere is far less than that of the top layer of the ocean. Hence the oceans store much more heat in the summer than the land or atmosphere. This heat is then released during the winter, as warm currents flow toward the poles. There may also be longer cycles, such as El Niños.
The consequences of continuing to let the ocean take one for the team are many. Increased ocean warming alters the "conveyor belt" of surface and deep ocean currents. This could impact the Gulf Stream which warms northern Europe.
Another possible effect of atmospheric warming in the far north would be to thaw some of the "permafrost" area, both above ground and under the Arctic Ocean. Climate warming is happening much faster in the polar regions than in the tropics. (All the climate models show this effect.) The rapid thinning of the ice and likely disappearance (in summer) of the ice in the Arctic Ocean is confirming evidence.
The fact that the poles are getting warmer faster than the tropics means that the north-south temperature gradient is growing smaller and less sharp. That, in turn, is pushing the northern jet stream northward (on average) at the rate of 2 km per year. This would permit both aerobic and anaerobic micro-organism activity under the soil surface to accelerate, releasing both carbon dioxide and methane into the atmosphere. The undersea "cousin" of permafrost on land, methane clathrate, could also start to thaw, releasing methane into the ocean and thence into the atmosphere, resulting in a positive feedback loop.
It seems likely that the rate of heat exchange in the deep oceans (not measured by Argo), depends on the thermohaline ("conveyor belt") circulation. It is probably much lower than surface heat exchange, since any mixing induced by storms is less important. The rates of mixing vs. conduction and convection are still not well-known. (The residence time of a water molecule in the oceans is estimated to be 3200 years.) An estimated 90 percent of the excess heat warms the oceans, and only 10 percent warms the land surface. The heat absorbed by the oceans causes thermal expansion of the water. Thermal expansion is one of the three possible causes of global mean sea-level (GMSL) rise.
The other two possible causes of GMSL rise are glacial ice melting and vertical land motion (VLM). Vertical motion results from the removal of the weight of glacial ice in certain terrestrial areas that were once ice-covered, such as northern Canada and Scandinavia. The VLM adjustment is fairly localised. In fact, it is negative (the sea floor is actually sinking, not rising, on average) because the land areas formerly covered by ice are now "springing back" as the weight of glacial ice was removed. The liquid magma under the Earth's crust gradually rearranges itself as the oceans get heavier and the land gets lighter.
Based on recent evidence, about one third of the GMSL rise – roughly 1.6 mm/year – is due to the thermal expansion of water and two thirds is due to the melting of glacier ice (mainly in Greenland and Antarctica). The quantitative change in ocean mass from glacier ice melting – as opposed to increased volume due to thermal expansion – is now being measured directly, not just estimated from indirect evidence. The ocean mass is now measured from satellites that detect extremely tiny changes in the gravitational attraction over each part of the Earth's surface. (Gravitational attraction is proportional to mass). This was not possible until after 2002, when ultra-sensitive new instruments for measurement of gravitational force were first utilised in the so-called Gravity Recovery and Climate Experiment (GRACE).
Throughout this series, I have demonstrated that the weight of the evidence is strongly in favour of the theory of anthropogenic climate change, even though there are some weak spots in the theory (water vapour) and the rate of change of sea-levels. The good news is that the temperature rise on the surface of the Earth may be somewhat slower than the worst case scenario. But the bad news is that the positive feedbacks in the system may be significantly greater than heretofore considered, as we can see with the oceans.
The bottom line is that there is no alternative non-anthropogenic theory to explain rising temperatures, melting glaciers, sea level rise and ocean acidification. If we don't act, the existing mechanisms of the climate will only reinforce the damage already done.

*Bob Ayres is an Emeritus Professor of Economics and Political Science and Technology Management at INSEAD and The Novartis Chair in Management and the Environment, Emeritus. He is the author of The Bubble Economy: Is Sustainable Growth Possible? and co-author of Crossing the Energy Divide: Moving from Fossil Fuel Dependence to a Clean-Energy Future

Links

20/10/2016

Out In The Heat: Why Poorer Suburbs Are More At Risk In Warming Cities

The Conversation -  | 

Upper Coomera is one of those fast-growing fringe suburbs that are hotter because of tightly packed housing with less greenery. Daryl Jones/www.ozaerial.com.au/
Australian cities are getting hotter. The many reasons for this include urban densification policies, climate change and social trends such as bigger houses and apartment living, which leave less space for gardens and trees. But some areas and some residents of cities are more exposed to heat than others.
The concentration of poorer people in hotter places is known as “thermal inequity”. Our recently published research has found this is a real concern on the Gold Coast, one of Australia’s fastest-growing urban regions.
Urban heat is known to increase rates of injury, death and disease. This is why the federal government recently established an urban greening agenda.
The central city tends to be hotter than surrounding suburbs and rural areas – the urban heat island effect. Perhaps because of this, much of the research focus has been on the urban core. But what about heat effects in the suburbs?

What is thermal inequity?
Research from North America and Australia shows people who live in greener, leafier suburbs tend to be wealthier. We know that urban greening can cool ambient air temperatures.
Plentiful street trees, well-designed parks and other types of green space also tend to increase residents’ physical activities and social interactions. This makes greener neighbourhoods healthier and happier.
Unfortunately, the opposite often occurs in poorer suburbs, meaning residents suffer more heat stress. This is a consequence of fewer street trees, less green space and denser urban design. Our research found thermal inequity is a real concern in Upper Coomera, a suburb in the northern growth corridor of Gold Coast city.
The Gold Coast has been coping with explosive rates of growth. The population is expected to double to more than 1 million in the next two decades. Growth-management policies are increasing densities in many suburbs.
On the suburban fringe in places like Upper Coomera, land clearing for development typically removes much of the native vegetation. This in turn increases heat.
The trend in the Gold Coast, like many cities, is for comparatively disadvantaged people to seek more affordable housing in outer suburbs. Less affluent householders become concentrated in suburbs where housing is packed tightly with fewer trees and less greenery.
Hotter houses and neighbourhoods lead to residents paying more for electricity to keep cool. Excessive heat can also increase healthcare expenses and reduce productivity.

Research shows residents are struggling
As we explain in the video abstract for our article, we used a mail-back survey of 1,921 households to examine three questions:
1) Are residents aware of climate change?
2) Are residents concerned about climate change?
3) Do residents understand the potential of green infrastructure to help neighbourhoods adapt to climate change?


Video abstract for Environmental Research Letters article on thermal inequity.

We found more than 90% of residents were aware of climate change and almost 70% were concerned about it. Residents living in townhouses were particularly worried. Paradoxically, those living in dwellings with dark roofs were less worried, as were those with larger families.
We also found that more than 90% of respondents had air conditioning. Using statistical analysis, we determined that renters are especially vulnerable to associated energy costs, as are those with kids.
Interestingly, we found that people living in townhouses were less likely to consider buying energy-efficient devices to lower household energy expenses, as were those with more children. This could be because renters and those with larger families may be struggling financially.
In sum, we found that more disadvantaged households with less disposable income were living in dwellings that were more vulnerable to heat.
Next, we examined the attitudes of residents to urban greening to help combat heat in their neighbourhood. We found almost two-thirds favoured tree planting. More than half felt local streets lacked shade.
Few trees to be seen: residential landscapes in Upper Coomera. Jason Byrne
While 90% of surveyed residents saw that shade was a key benefit of trees, just over half understood that trees can lower air temperatures. Although most residents recognised maintenance costs of trees as a disadvantage, they still favoured more urban greening.

So what can be done?
Our findings have important repercussions for urban policy. As we have previously noted, urban greening has many advantages for climate change adaptation. It is comparatively inexpensive and is politically palatable.
However, higher-density neighbourhoods like Upper Coomera often have less land available for greening. Yards are smaller and verges are typically dominated by on-street parking.
We advocate for education campaigns about the benefits of urban greening and better urban design guidelines to make it easier for developers to increase neighbourhood greenery. Better knowledge about species selection is needed to reduce maintenance issues.
Urban greening initiatives should also use technologies like permeable paving to limit pavement uplift and capture rainfall on-site.
Thermal inequity exists but it can be reduced. After all, if urban greenery can benefit all residents, why should the poor miss out?

The authors wish to acknowledge the contribution of Chloe Portanger, Information Analytics Specialist with Climate Planning, to the research on which this article is based.

Links

NASA Analysis Finds Warmest September on Record By Narrow Margin

Goddard Institute for Space Studies

September 2016 was the warmest September in 136 years of modern record-keeping, according to a monthly analysis of global temperatures by scientists at NASA's Goddard Institute for Space Studies (GISS) in New York.

Monthly temperature anomalies with base 1980-2015, superimposed on a 1980-2015 mean seasonal cycle. (Credit: NASA/GISS/Schmidt) —  View larger image
September 2016's temperature was a razor-thin 0.004 degrees Celsius warmer than the previous warmest September in 2014.
The margin is so narrow those two months are in a statistical tie.
Last month was 0.91 degrees Celsius warmer than the mean September temperature from 1951-1980.
The record-warm September means 11 of the past 12 consecutive months dating back to October 2015 have set new monthly high-temperature records.
Updates to the input data have meant that June 2016, previously reported to have been the warmest June on record, is, in GISS's updated analysis, the third warmest June behind 2015 and 1998 after receiving additional temperature readings from Antarctica.
The late reports lowered the June 2016 anomaly by 0.05 degrees Celsius to 0.75.
"Monthly rankings are sensitive to updates in the record, and our latest update to mid-winter readings from the South Pole has changed the ranking for June," said GISS director Gavin Schmidt.
"We continue to stress that while monthly rankings are newsworthy, they are not nearly as important as long-term trends."
A map of the September 2016 LOTI (land-ocean temperature index) anomaly, showing that much of the warmer temperatures occurred in the northern hemisphere. (Credit: NASA/GISS) — View larger image
The monthly analysis by the GISS team is assembled from publicly available data acquired by about 6,300 meteorological stations around the world, ship and buoy-based instruments measuring sea surface temperature, and Antarctic research stations.
The modern global temperature record begins around 1880 because previous observations didn't cover enough of the planet.
Monthly analyses are updated when additional data become available, and the results are subject to change. 

Links

Sorry, Shock Jocks, But The Public Isn't Buying Into A Renewable Energy Panic

The Guardian - 

Despite a concerted effort to create a panic about renewable energy following the South Australian storm, public support for ambitious renewable energy targets remains high
‘If renewables are popular with the public, have not been blamed for the blackout by any authoritative source and, by definition are better for the environment, where is all the vitriol coming from?’ Photograph: Bloomberg/Bloomberg via Getty Images
The lights had not even come back on in South Australia after the freak storm that blacked out the state last month when the latest front in the climate wars was breaking out.
The pushback against the state’s 41% reliance on renewables, notably wind farms, has attracted a gumbo of opportunists seeking to push their particular carbon barrows.
There was the federal energy minister, Josh Frydenberg, attempting to justify his less-than ambitious renewable energy target, there was the king of South Australian populism, Nick Xenophon, jumping on the nearest bandwagon and there was the deputy prime minister, Barnaby Joyce, who just hates wind farms.
Close behind them and was the peak industry group, ACCI, calling for an independent review of the state’s energy mix while rightwing shock jocks across the nation took up the opportunity to move beyond the increasingly settled debate on climate science to find a new target for their vitriol.
And presiding over it all was a prime minister who appears to have ceased to even realise when he is trashing his own political integrity.
If it all looked like a pre-prepared and coordinated campaign by the Coal Club, that’s because it probably was.
Essential has been following the issue over recent weeks to monitor whether the SA blackouts have the capacity to spark another climate panic, not so much the Big New Tax On Everything, as much as the Big Black Out.
The short answer is that the public isn’t buying the renewable panic.

Some people have said the recent power black out in South Australia was a result of too much reliance on renewable energy. Others have said that the storm damage would have shut down the power grid regardless of how the electricity was produced. Which is closest to your view?
Yes, a quarter of Coalition voters reject the experts and see a causal relationship that even the prime minister and his energy minister didn’t really assert. But the 60% figure who don’t represents a significant rebuff.
And those findings are reflected in broader attitudes towards renewables – when asked to choose between threat or solution, the signals are clear if not unanimous.

Do you think renewable energy is the solution to our future energy needs or is renewable energy a threat to our future energy supply?
So  if renewables are popular with the public, have not been blamed for the blackout by any authoritative source and, by definition are better for the environment, where is all the vitriol coming from?
Early every year, the commonwealth publishes the Energy in Australia report giving a snapshot of the industry. The numbers provide a compelling context to this debate.
  • Energy occupies a central place in the Australian economy. It’s 6% of the economy or about $100bn value add, and responsible 155,000 jobs.
  • Nearly three-quarters of that value comes from coal mining, oil and gas extraction, and petroleum and coal product manufacturing, most of it for export.
  • Australia produces three times as much energy as we consume: we are number eight in the world for production versus number 20 in the world for consumption.
  • We have 100 years of coal reserves and 50 years of gas reserves.
  • And despite the emerging consensus on climate change, growth in Australian energy production in the decade to 2013-14 was twice as fast for black coal and gas as it was for renewables.
It’s hardly a surprise then that the owners and other beneficiaries of those future earnings – that’s the corporates and the government – are seeking to defend these future earnings.
Clean energy threatens their international markets for electricity fuel and production and also for transport where the substitution of clean electricity for liquid fuels is only constrained by fast-evolving battery technology.
Any serious view on de-carbonisation implies a massive downgrade in expectations of future earnings and thus market value for these players.
That’s where South Australia is one of the world’s biggest challenges to the market value of those bedrock Australian industries because it has moved fastest in shifting its energy mix.
But while it is an early adapter it is not an outlier. According to Navigant research for US industry association Advanced Energy Economy (AEE), global “advanced energy” revenues went from $1.08tn in 2011 to $1.35tn in 2015. That’s up 25% in four years.
Quoting the World Bank, Navigant says that from 2014 to 2015, advanced energy revenue grew at more than three times the rate of the world economy overall.
That’s a global market of $2tn by 2020 or soon after. Even if you discount for some debatable AEE inclusions such as nuclear, that’s a massive global market.
The size and speed of the national and state renewable energy targets are key drivers of Australia building its own “advanced energy” market, albeit at the cost of the existing Australian energy players.
The difference in ambition is becoming one of the fault lines of the major political parties, with Labor’s national 50% target more than double the current Coalition position.
Again our figures show the public is backing a fundamental energy transition.

The Labor Party is committed to a target of 50% renewable energy by 2030. An independent report has said this policy would require about $48 billion of new private sector (not Government) investment in large scale renewable energy production such as solar and wind farms. Do you approve or disapprove of this policy?

But there’s a caution to these numbers.
There was a time when support for a market response to climate change seemed almost as universal. Through the final term of the Howard government, the consensus developed until support for an emissions trading scheme was bi-partisan.
The rest is history. Rudd spends too long designing the mechanism, fails to steward a global deal. Turnbull loses his base and his job, Rudd drops the “great moral challenge of the time” and his job too. Then Gillard spills the drinks.
“The big new tax on everything” becomes political poison, the exaggerated price is too high and the consensus collapses along with faith in the science, leaving Tony Abbott to sup on the spoils.
The lesson of climate politics of the past decade has been never to under-estimate self interest.
While the mood may be right for Labor and Australia’s emerging clean energy industry, they would be foolish to under-estimate the fossil fuel industry’s capacity to slow down what seems inevitable.

Links

19/10/2016

Storm Of Controversy Erupts Over AEMO Blackout Report

Renew Economy - Giles Parkinson

Another storm of controversy about the role of wind energy is certain to erupt after the latest report about the state-wide blackout in South Australia by the Australian Energy Market Operator.
In its second update, AEMO has pointed the finger at settings on certain wind farms and fossil fuel generators in the events immediately before and after the state-wide outage last month, but the handling of the report has also raised questions about the actions of the market operator itself – both before and after the event.
The report dismisses suggestions – mostly from the Coalition and mainstream media – that it was the intermittent nature of wind energy that was the cause of the blackout. But it also underlines the failure of the market operator to make any preparations for the storm that it could obviously see spreading across the state.
The AEMO makes clear that it was major voltage disturbances – six in 80 seconds – caused by the collapse of three major transmission lines that led to the blackout. "Five transmission line faults, resulting in six voltage disturbances on the network, led to the SA region black system," it writes.
But – not for the first time – AEMO's press release and executive summary differs in emphasis to the detailed report, and focuses on the role of the so-called "self protect mechanisms" in wind farms rather than major voltage collapse that followed the collapse of the transmission lines.
Even though these self protect mechanisms are just a matter of software and are easily fixed, AEMO's emphasis has horrified many in the wind industry, who suggest that the market operator is deliberately allowing wind to be blamed even though its report highlights a collapse of voltage that could have been the main cause of the outage. They also point to basic errors in its report, and its failure to take any preventative action as the storms approached.
"What we see in this report is a concerted effort to focus solely on the wind farms as if the system is perfect and the market perfect," said one wind farm operator. "I think we are now at war with the system operator."
In the summary, AEMO points to the role of wind farm self protect mechanisms as the straw that broke the grid's back, noting that many wind farms were designed to switch off after riding through as few as two voltage events. (This is disputed by some wind farms, who suggest their limit was actually three).
These so-called fault ride-through limits relate to factory settings – what South Australia energy minister Tom Koutsantonis describes as a "software issue" – and these have now been fixed at most of the wind farms. Those wind facilities without such limits rode through the events without any problems until the inter-connector closed.
AEMO was also careful to point out that the role of wind energy in the blackout had nothing to do with its "intermittency" or its ability to generate through high wind events, as many wind critics had suggested in the aftermath of the blackout. (See our separate story "Blackout report blows away big myths about role of wind energy").
"The most well-known characteristic of wind power, variation of output with wind strength (often termed 'intermittency'), was not a material factor in the events of 28 September 2016," it notes in the report.
However, the point of contention lies around AEMO's assertion that it was the role of the self protect mechanisms and the loss of 445MW of output that caused the Heywood inter-connector to overload and trip, separating South Australia from the rest of the grid and precipitating the system-wide blackout.
Energy experts point to the detail of the report and the collapse of voltage that occurred before two of the biggest wind farms switched off, suggesting that the system was unstable and would have tripped anyway.
As the AEMO report noted, voltage after the collapse of the last transmission line fell to 40 per cent of the line's rating. Given that most equipment, as the AEMO report notes, is designed to self protect if voltage falls by more than 10 per cent, they wonder why the market operator would expect a generator should ride through voltage collapse of such magnitude.
They point to this graph below, showing the voltage change immediately after a failed attempt to re-connect the third major transmission line to have collapsed after the storms. The energy experts say that this shows a massive voltage collapse that was happening anyway.
"To suggest that loss of generation is the final straw is misleading," said one. "When you see this graph it is clear that the whole system had become unstable, and nothing was going to ride through that voltage collapse."
"No power grid in the world is designed to manage the rapid consecutive collapse of three major transmission lines like the SA system sustained on 28 September," said Kane Thornton, the CEO of the Clean Energy Council.
The wind industry is angry and frustrated that while the exact cause is unlikely to be known until the final report is completed in six months time, wind energy has been left to take the rap in the interim – and for a technical issue that is easily fixed and may not even have been as significant a factor as AEMO is making out.
And while the report does make clear that the issues with the wind farms are technical, and easily fixed, there is no doubt that the political and ideological debate will be fierce, and won't be confined to the facts.
But the report also points to two other major problems.
The first is that fossil fuels are not a panacea as some would wish. The diesel and gas generators paid handsomely to provide black start services to the state both failed, one within 15 seconds, causing the blackout to last much longer than it would have done otherwise. AEMO refuses to name the failed generators, citing "confidentiality" agreements.
The three diesel generators that should have provided power to Port Lincoln also failed – two tripped almost immediately and the third had to be shut down.
And, as the report also notes, this is not the first time that the Heywood interconnector has been separated from the state. Three of the previous disconnections occurred when the main coal generator, the now closed Northern brown coal power station, tripped and caused the system to collapse. The other occurred when bushfires in Victoria caused multiple transmission line failures.
The other issue is one of culture. As grid operators in china, the US and Europe have noted on many occasions, the big issues with the transition to renewables are not really technical, but cultural. This will be a question asked of the AEMO, and an independent assessment of its own actions is now called for.
Its report basically admits that the market operator had no Plan B for the storm. Some suggest it didn't even have a Plan A.
It made no provision for extra back-up generation or for locally based ancillary services that could have stabilised the grid at its point of crisis and avoided the black-out. These ancillary services normally come from gas generators, but could in the future be provided by battery storage.
And it didn't scale down the amount of power coming through the interconnector. It meant, that like a central bank with interest rates close to zero, it had no levers left to pull in case something went wrong. Its report suggests it was more worried about price impacts than system security.
And it seems that AEMO simply didn't believe that the system was at risk. That approach seems extraordinary given its own admission that the winds of 120kmh were forecast, more than the rating of some wind farms in the state.
"Given the available evidence in advance of the storm hitting, one has to wonder why on Earth they (AEMO) didn't re-classify the risks of the loss of one or more transmission lines or generators as a credible contingency," says Andrew Stock, from the Climate Council and a former senior executive with coal and gas generator Origin Energy
"It would have been very unusual for senior management in a very high risk operation, in the face of evidence of a forthcoming storm, not to take precautionary actions to pre-emptively mitigate perceived risks.
"It's a bit like driving a performance car flat out into a storm, which most people would think would have been foolhardy. On what basis did they form those judgments?
"In my experience it is very unusual for senior management in a very high risk operation, in the face of evidence of a forthcoming storm, not to take precautionary actions to pre-emptively mitigate perceived risks."

Links

Super Typhoons And A Soaking For Australia: Weird Weather Explained

Fairfax - Peter Hannam

As the Philippines braces for its second major typhoon in just five days, a Canadian glacier spawns a giant iceberg and eastern Australia mops up from a record wet spell, climate scientists can pick from a world of weird weather to highlight evidence of global warming under way.
Just days after nations agreed to curb production of greenhouse gases 10,000 times more potent than carbon dioxide and a fortnight before the Paris climate agreement comes into force on November 4, many regions are experiencing bizarre conditions.
September continued the run of exceptional global warmth, with last month narrowly edging last year as the hottest September on record, NASA, the US space agency, said overnight.
After data adjustments, NASA said 11 of the past 12 months had set monthly high-temperature records. (See chart below). This year is on course to smash previous records for annual heat set in 2015 and in the year before that.
Climate scientists, such as NASA's Gavin Schmidt, emphasise that while individual weather events and even monthly rankings may be newsworthy, "they are not nearly as important as long-term trends"
Here, though, there are many worrying pointers.
The Philippines is facing the potential for a category 5-strength typhoon Haima just days after typhoon Sarika blew through, leaving a trial of death and destruction that has now extended to neighbours Vietnam and China.
Typhoon Haima is expected to reach category 5 strength by Wednesday. Photo: The Weather Channel
Recent research indicates the western Pacific is experiencing stronger cyclones with the frequency increasing as much as four-fold.

Porcupine spike
In Canada, the Porcupine Glacier in British Columbia retreated more than two kilometres "in one leap", when a major iceberg broke off during the summer, The Globe and Mail reported recently. (See their chart below:)
Haitians, hard hit by Hurricane Matthew, await aid from a US helicopter earlier this month. Photo: Rebecca Blackwell

Mauri Pelto, professor of environmental science at Nichols College in Massachusetts, said he couldn't identify a bigger iceberg carved from a Canadian glacier in a quarter century of work.
"It's just a highlight example of what's happening [from climate change]," Dr. Pelto was quoted as saying. "I have worked on over 200 glaciers just in that area, and all but one have been retreating."
The behaviour of ice of a different kind caught the attention of  Andy Pitman, director of the ARC Excellence for Climate System Science at the University of NSW.
After rivalling previously lows in 2007 and 2012, this year's recovery of Arctic sea ice as winter approaches has slowed sharply, placing it again at record low levels. (See chart below, supplied via Zack Labe, from the University of California, Irvine.)
With less sea ice, more of the sun's energy is absorbed by the Arctic seas rather than reflected back to space, accelerating the pace of warming in an area that's warming faster than almost anywhere else.
"It's moving outside it's normal operating range," Professor Pitman said of the sea ice trend. "Climate extremes are emerging much faster than climate scientists thought."

Rain extremes
While major weather events can't all be attributed to climate change rather than natural variability, a warming world makes them more likely.
Scientists, for instance, estimate that the atmosphere can hold 7 per cent more moisture for each degree of warming - and we've had at least that since the Industrial Revolution triggered a rapid increase in greenhouse gases from the burning of fossil fuels and land-clearing for agriculture.
Hurricane Matthew, which scrapped along the east coast of the US earlier this month, is estimated to have dumped as much 52 trillion litres on the US, triggering widespread flooding, according to Ryan Maue, a US-based meteorologist.
Typhoon Sarika, which left at least 25 dead in the Philippines last week, is now expected to bring flooding rains to south-east China.
Behind Sarika, though, looms a more powerful storm, super typhoon Haima, which is likely to generate peak gusts of more than 300 km/h by Wednesday as it nears the northern Philippine island of Luzon.
"[A]long with the dangers of storm surge flooding and damaging winds, rainfall flooding and landslides would also be major threats in Luzon, given saturated ground from Sarika," the weather.com website said in a report. "More than a foot of rain could fall over northern portions of Luzon as Haima moves through."
Much of eastern Australia has copped its drenching in recent weeks, although the rains have fortunately been more spread out.
As the Bureau of Meteorology said in a special climate statement last week, the Murray Darling Basin had its wettest September on record, continuing a string of wet months.
"The May to September period was Australia's wettest on record, with each of the five individual months ranking in the 10 wettest in the last 117 years," the report said.

'Off the charts'
"You're seeing more extreme events and in most of the parts of climate that affect people," Professor Pitman said.
Heatwaves, for instance, that used to last typically three days, might be stretching in some places out to 10 days.
"It's like Usain Bolt doing a 4-second,100-metre run," he said. "It's completely off the charts."
Professor Pitman's centre will shift more of its focus to the study of climate extremes after securing funds from the Australian Research Council last month.
"There is some emerging evidence that the system is redefining itself," Professor Pitman said.

Links

Lethal Heating is a citizens' initiative