Solar panels are still a rarity in WA’s lower-income areas.
Orderinchaos/Wikimedia Commons, CC BY-SA
Many Western Australian householders are living in “energy poverty”,
according to our new Bankwest Curtin Economics Centre research report, Power to the People: WA’s Energy Future.
Although average household spending on electricity, gas and heating
is no more than 4% of income, the figure rises considerably for those on
lower incomes. In particular, more than a quarter of single-parent
families say they spend more than 10% of their income on energy.
Single parents in particular are far more exposed to energy poverty, a
trend that has grown over the past 10 years. Around one in ten of these
households spends at least 15% of their income on energy costs. In some
cases, this forces them to compromise on other essentials such as food
and health care.
Rising energy costs, as well as a personal commitment to reducing
greenhouse gases, are motivating many WA households to vote with their
feet (or wallets) and adopt rooftop solar photovoltaic (PV) panels at a
dramatic rate.
In WA, the installed capacity of rooftop solar PV has grown by 37% in
the past 18 months alone. Around 25% of suitable dwellings are now
fitted with solar panels. This takes WA to third place among Australian
states, behind Queensland (32%) and South Australia (31%).
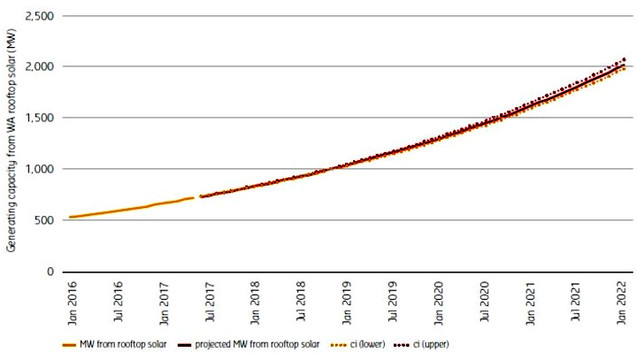
If this trend continues, the state’s rooftop solar PV capacity is
predicted to exceed 2,000 megawatts by 2022. That’s larger than all but
one of WA’s power stations.
Generating capacity from WA rooftop solar, 2016 to 2022
Projections are based on predictions
from a log linear regression of total MW of rooftop solar PV capacity,
and reflect the growth both in the number of installations and the
average MW output per solar PV installation.Bankwest Curtin Economics Centre/Clean Energy Regulator
Similar trends are predicted at a national level, with consumer-bought rooftop solar PV expected to account for around 24% of electricity generation by 2040.
This is set to make Australia one of the most decentralised electricity
networks in the world, with 45% of its total generating capacity coming
from “behind the meter”.
Haves and have-nots
Rooftop solar is a popular option, but not all households are able to
take advantage of this technology. Our report reveals a clear
socioeconomic gradient in household solar installations in WA.
Panels are fitted to only 7.4% of suitable homes in areas in the
lowest 10% on socioeconomic indicators. That figure rises to 16% in the
next-lowest 10%, and the gap widens still further as income rises. Solar
installation rates are around 30% in mid-to-high socioeconomic areas.
Share of suitable WA homes with solar panels, by level of socioeconomic disadvantage
Homes deemed suitable for solar PV
include detached, semi-detached or terraced houses, but not
strata-titled apartments or units.Bankwest Curtin Economics Centre/Clean Energy Regulator/ABS
Better incentives could boost these numbers,
especially in poorer areas. The initial upfront costs deter many
homeowners, while most landlords have little financial motivation to
install solar on rental properties.
Accessible, secure and affordable energy is essential to any
well-functioning economy. And many citizens, communities and
governments are acting on the imperative to move to a greener source.
Despite its huge amounts of wind and sunshine, WA lags behind other
states both in committing to a clear renewable energy target and in its
investment in large-scale renewable power projects.
Renewable projects under construction or at commissioning stage in 2017
Projects at the commissioning phase
at the end of 2016 are not included in the total new capacity figure.
Investment in the South Australia Hornsdale Wind Farm includes stages 1,
2 and 3. Data for ACT and NT not available; ACT is expected to draw
most of its renewable energy from other states and territories.Bankwest Curtin Economics Centre/Clean Energy Council Australia/various other sources
According to our report, WA’s total greenhouse gas emissions in 2015
were 86.5 million tonnes of carbon dioxide equivalent – fourth-ranked
behind Queensland, New South Wales and Victoria. This means WA
contributed 16.1% of Australia’s national emissions that year.
But while other states and territories have adopted proactive
emissions-reduction policies such as state-based renewable energy
targets, WA has not yet taken substantial action on this front.
Here’s the likely game-changer: efficient, cost-effective battery storage that can deliver power at the scale required. Storage is set to become vital, both for smoothing out domestic power consumption from solar panels and for large-scale electricity generation. The Finkel Review
has recommended that all future renewable energy projects be required
to produce “dispatchable” power – that is, be able to store their power
and release it at times of higher demand.
Greater efficiency in balancing energy demand over the course of the
day, and across large-scale grid systems that feature a range of
different weather conditions, is also likely to help overcome the
intermittency problems associated with renewable sources.
Australia is on the cusp of an energy revolution, and the pace of
change is only going to increase. WA, like every state, needs a clear
roadmap to navigate the journey effectively, one that integrates
existing and emerging energy technologies and maintains protections for
families who cannot currently afford solar panels.
This will give greater certainty to the energy future we can all expect – and, critically, ensure that no one is left behind.
Changes in sea level height from 1993 to 2017 compared with a
long-term mean of the data. Blue and purple are lower than the mean;
red, yellow and white are higher. Image credit: NASA/JPL-Caltech.
August 10 marked the 25th anniversary of the launch of a
revolutionary ocean research vessel — a space "ship." As the NASA/CNES
Topex-Poseidon satellite ascended into orbit, it ushered in a new era of
oceanography with the first highly accurate, global measurements of sea
levels. That mission and its three successors, all named Jason, have
continuously mapped global ocean currents and tides; opened our eyes to
the global reach of El Niño and other climate events; created a
quarter-century-long, extraordinarily precise record of global and
regional sea level rise; and enabled improved forecasts of extreme
weather events such as hurricanes, floods and droughts.
A new slideshow celebrates this important data set — a fundamental
measurement for the study of the oceans and climate — and the
longstanding U.S.-French collaboration that brought it about.
In 1992, when Topex-Poseidon launched, no one foresaw that its record
of precision ocean height measurements would continue through three
decades and four spacecraft. In fact, many oceanographers at the time
weren't convinced that Topex-Poseidon's sensors would be accurate enough
to reveal the signal of sea level rise out of the noise of waves, tides
and other changes. But the radar altimeter and radiometer measurement
system outperformed expectations from the start. In 25 years of
continuous operation, Topex-Poseidon and its successors have recorded
2.8 inches (7 centimeters) of global average sea level rise.
Our planet’s oceans are too vast and complex to be fully measured by
any single satellite, or even by any single nation. Topex-Poseidon and
its successor Jason satellite missions are shining examples of the power
of a sustained, long-term international partnership, led by the U.S.
and French space agencies, NASA and CNES. For nearly three decades,
NASA and CNES scientists and engineers have pooled their expertise,
talents and insights to design and construct an integrated spaceborne
measurement system far more powerful than the sum of its parts. NASA and
CNES have worked together, applying advanced technology to collect
measurements of remarkable precision and accuracy, and then making those
measurements freely and openly available. With this effort, they have
provided humanity with unprecedented views of the global oceans, how
they change on time scales of days to decades, and how the oceans
influence — and respond to — weather and climate.
“For more than a generation, NASA and CNES scientists and engineers
have collaborated to make exquisitely accurate measurements of the ocean
surface from space, providing insights into the workings and
interactions of our planet’s two great fluid systems, the oceans and the
atmosphere,” said Michael Freilich, director of NASA’s Earth Science
Division in Washington.
Ocean currents
This is an animation of ocean surface currents from June 2005 to
December 2007 from NASA satellites. Watch how bigger currents like the
Gulf Stream in the Atlantic Ocean and the Kuroshio in the Pacific carry
warm waters across thousands of miles at speeds greater than four miles
per hour (six kilometers per hour); how coastal currents like the
Agulhas in the Southern Hemisphere move equatorial waters toward Earth's
poles; and how thousands of other ocean currents are confined to
particular regions and form slow-moving, circular pools called eddies.
Credit: NASA/SVS. Download video.
The Topex-Poseidon mission was the first to monitor the changing
patterns of major ocean surface currents in a comprehensive way. Ocean
current locations are revealed by large-scale hills and valleys on the
ocean surface, which can vary by more than 6 feet (2 meters) in height.
The peaks and dips defining the ocean’s topography are caused by
variations in water temperature and pressure. Large-scale currents like
the Gulf Stream tend to flow along contours of constant ocean height,
following the sides of the hills and valleys. The steepness of a slope
indicates the speed of the current. Unlike terrain on land, however, the
liquid "landscape" shifts with changes in winds, temperature and other
factors, causing shifts in the locations and speeds of the currents. The
only way to monitor these changes over the entire surface of Earth's
ocean is to make precise measurements of the height of the ocean surface
from orbiting satellites.
Measuring the ocean shape over nearly the entire globe every 10 days,
Topex-Poseidon gave the first quantitative view of how ocean currents
change with the seasons. Topex/Poseidon and the Jason-1, Jason-2 and
Jason-3 missions have provided unique insights into how ocean
circulation affects climate by moving heat from place to place on our
planet.
Heat storage in the ocean
NOAA's annual assessment of the heat in the upper ocean (2015 shown), a
measure of global warming, draws on Topex series data. Image credit:
NOAA.
More than 90 percent of the heat from global warming is stored in the
ocean, which means oceans are key players in global climate. Heat
causes ocean water to expand, adding to sea level rise. Measuring both
long-term sea level trends and the shape of the ocean surface related to
currents, Topex-Poseidon and the Jason series provide two basic
ingredients for understanding the ocean's role in global climate
variations.
"As human-caused global warming drives sea levels higher and higher,
we are literally contributing to the reshaping of the surface of our
planet," said Josh Willis, NASA project scientist for Jason-3 at NASA's
Jet Propulsion Laboratory in Pasadena, California. "The precision
altimetric satellite missions tell us how much and how fast."
El Niño, La Niña, and more
Among Topex-Poseidon's early achievements was recording the full extent
of a record El Niño in 1997 and the succeeding La Niña in 1999. Darker
colors are sea levels lower than normal, lighter and white colors are
higher than normal. Image credit: NASA/JPL-Caltech.
For decades, scientists could not predict how El Niño and other
year-to-year ocean variations changed regional weather. That was partly
because, using only ships and buoys, they couldn't observe the genesis
and growth of these changes far out in the equatorial Pacific.
Topex-Poseidon and the Jason satellites have given the first frequent,
global views of the full extent and life cycles of El Niño and La Niña
events. Lee-Lueng Fu of JPL — project scientist for the first two ocean
altimetry missions — pointed out, "Topex-Poseidon allowed us to follow
their evolution and showed that these events weren't limited to just the
tropics. It also gave us evidence of even longer-lasting ocean
variations." One of these is the Pacific Decadal Oscillation, similar to
El Niño and La Niña in character but with phases lasting up to several
decades.
In the last 25 years, with the help of altimetry data, scientists
have pinpointed many global connections between these multi-year ocean
variations and weather consequences such as drought and flooding
throughout the globe. While these events have by no means yielded all
their secrets, they are better understood and better forecast than
before global spaceborne observations began.
Tides on the open ocean
A numerical model of daily global tides using sea level data from Topex-Poseidon. Image credit: ESR.
Before satellite measurements, deep-ocean tide measurements were
difficult to make, expensive and sparse. Topex-Poseidon made the first
global maps of tides, which changed scientists' understanding of how
tides dissipate. The data show that a third of tidal energy dissipates
in the open ocean, playing important and previously unknown roles in
mixing water within the ocean.
Jason-1
Topex-Poseidon had a three-year prime mission, but long before that
time was up, oceanographers and other Earth scientists recognized the
value of continuing its measurements as long as possible. Fu explained,
"Sea surface height is a fundamental measure of the Earth system, so it
was a no-brainer that scientists would want to have this kind of
information indefinitely." With strong community support, Jason-1 was
constructed by NASA and CNES and launched in December 2001. For three
years, Topex-Poseidon and Jason-1 flew in coordinated orbits that
allowed scientists to cross-calibrate their measurements and then
combine the data sets to observe the global oceans more frequently. Each
succeeding mission has also overlapped its predecessor, ensuring a
consistent data record.
So far, each of the ocean altimetry missions has proven to be
long-lived. Topex-Poseidon was eventually decommissioned in 2005 after
13 years in orbit. Jason-1 survived almost 12 years, until July 2013.
Nine-year-old Jason-2 and Jason-3 (launched in January 2016) are still
in operation.
Jason-2
Lee Fu (left) was the project scientist for Topex Poseidon and Jason-1
and -2. Josh Willis is the current project scientist for Jason-2 and -3.
Image credit: NASA/JPL-Caltech.
With the launch of Jason-2 in June 2008, the focus of spaceborne
ocean altimetry transitioned from research objectives to data
applications providing tangible benefits to society. Mission operations
moved from the research agencies NASA and CNES to the U.S. National
Oceanic and Atmospheric Administration (NOAA) and the European
Organisation for the Exploitation of Meteorological Satellites
(EUMETSAT); indeed, satellite altimeter measurements are used routinely
in NOAA’s El Niño forecasts. NASA and CNES continue to provide science
teams, instrument design, and science-focused, specialized data
management.
Forecasting
Jason-1 data contributed to this forecast of Hurricane Rita's track
across the Gulf of Mexico in 2005. The storm track appears as a black
line. Jason-1 observed a tongue of very warm water (red) in the gulf,
13-23 inches (35-60 centimeters) higher than surrounding water. Ocean
heat can strengthen hurricane intensity. Image credit:
NASA/JPL-Caltech/University of Colorado.
On smaller space and time scales, satellite altimetry measurements
provide information directly useful for marine storm prediction.
Hurricanes are fueled by heat stored in the ocean below, and since the
upper ocean expands and contracts as it heats and cools, sea level
height is a marker for water temperature and heat content. So it is
hardly surprising that ocean altimetry data are routinely used in
forecasting hurricane strength.
In 2014, an unexpected forecasting use for altimetry data became
operational. Bangladesh, whose 46-year history has encompassed
death-dealing river floods, uses Jason-2 measurements of river levels in
its flood forecasting and warning system. Within the first year using
these data, Bangladesh's system enabled the most accurate, long-lead
flood warnings ever given for that nation.
Navigation
The U.S. Navy uses the ocean altimetry satellites' data to aid surface and underwater navigation. Image credit: U.S. Navy.
Civilian sailors and the U.S. Navy use the series' near-real-time
data on currents, eddies, winds and waves to aid surface and underwater
navigation. Information on eddy currents in the Gulf of Mexico has been
used by marine operators to schedule offshore drilling operations, with
significant cost savings.
Jason-3
Artist's rendering of Jason-3. Image credit: NASA/JPL-Caltech.
When Jason-3 launched in 2016, NASA project scientist Willis
commented, "This mission has big shoes to fill. Its predecessors have
built one of the clearest records we have of our changing climate."
Jason-3 has performed flawlessly in continuing the global record of
precise sea-surface topography measurements and is now halfway through
its prime mission.
A new role for Jason-2
Jason-2's new, lower orbit will allow scientists — such as Walter H. Smith
(NOAA) and David Sandwell (Scripps Institution of Oceanography), who
produced this map — to improve their understanding of features on the
global seafloor. Image credit: NOAA.
This year, Jason-2's onboard systems began to show signs of space
radiation damage. The mission management decided to lower the satellite
out of its shared orbit with Jason-3. At the urging of the science
community, the satellite was lowered by 17 miles (27 kilometers), where
it will collect data along a series of ground tracks only 5 miles (8
kilometers) apart, with a one-year repeat cycle.
Besides protecting Jason-3, the new orbit will allow Jason-2 to
produce an improved, high-resolution estimate of Earth's average sea
surface height. Because ocean topography is partly determined by the
contours on the ocean bottom, the estimate is expected to enable
scientists to improve maps of the seafloor, resolving currently unknown
details of underwater features such as seamounts. These maps will permit
advances in ocean modeling, tsunami wave forecasting and naval
operations support.
Into the future
Illustration of the upcoming Sentinel-6 mission. Image credit: ESA.
The next ocean altimetry mission, expected to launch in 2020, is
called Jason Continuity of Service (Jason-CS) on the Sentinel-6 mission.
As the long name implies, it will carry on the proud Jason legacy, but
with a new partner: the European Space Agency. EUMETSAT will lead the
mission, and NASA's role will remain similar to its role in Jason-3.
CNES will assess and evaluate the performance of the mission and provide
precise orbit determination.
Satellites have already revolutionized oceanography, and soon they
will do the same for hydrology -- the study of water on land. The
French/U.S. Surface Water and Ocean Topography (SWOT) mission will be at
the forefront, carrying an innovative interferometer dubbed KaRin that
marks a break with today's technologies.
Fu notes that these changes show the value the world scientific
community places on the ocean altimetry program. "The measurement is so
important, and the technology is fully demonstrated," he said. "In the
long haul, ocean altimetry is an international commitment."
Donald Trump has done many things to tarnish America’s reputation, but his decision to walk away from the Paris Agreement
is probably the most internationally symbolic and damaging. That a US
president can put climate change denial at the centre of his climate and
energy policy is truly unprecedented, and it is difficult to remember
an administration that has been so intent on undermining the intellectual and scientific findings on global warming.
Fighting back against Trump’s climate folly seems to be an uphill task. Even the impending publication of the Climate Science Special Report,
drafted by scientists from 13 federal agencies, is unlikely to do much.
The final report is expected to warn of the dangers of climate change,
but it will most likely be surreptitiously sidelined.
One of the reasons behind Trump’s bullish attitude might be to do
with public opinion in the US. In a poll carried out by Yale University
in 2016, 70% of Americans said they believed in global warming
and 58% believed that it will harm Americans. However, only 40% believe
that it will actually impact them individually. Furthermore, just 24%
said they heard about global warming in the media every week.
In a poll conducted by the Pew Research Centre this year, 76% said
terrorism should be a top priority for the administration. Only 38% mentioned global warming.
The polls suggest that Americans might be concerned about global
warming and want more to be done about it. But they are more likely to
be worried about, say, Kim Jong-un than climate change.
It’s a Chinese conspiracy, folks.Avivi Aharon / shutterstock
It appears that confronting Trump – or any other climate denier – on the basis of facts simply won’t work.
The challenge should perhaps be to first rally public opinion until
there is an overwhelming consensus that serious and urgent action is
needed.
One practical short-term solution might be to shift the public
discourse from “climate change” to “pollution”. Focusing on pollution
has three advantages that may mean it moves public opinion better than
global warming.
Can’t see ‘warming’
First, pollution is tangible. The fact that glaciers are melting
might be alarming but it is not something that most of us experience in
everyday life. And why would a rise in temperature matter as much to
someone living in Sacramento, California, where it is already hot and
where one can find shelter in air conditioned buildings?
Pollution, however, can be experienced on a daily basis and causes
nuisances of all sorts. The same Sacramento resident who is indifferent
to global warming might be concerned with the pollution in their local urban river parkway, for instance. In addition, reports claiming that there are millions of annual deaths
from air pollution have a different, more personal ring from those
making the more abstract claim that “global temperatures” are rising
fast.
People care about pollution
Americans also seem to be more concerned about the environment than global warming. In the same opinion poll
carried out by Pew, 55% of Americans saw “the environment” as a
priority, a similar score to crime or poverty (and comfortably ahead of
the military, immigration or “global warming”). They seem to be more
worried about the quality of air and water where they live rather than
losing sleep over a global climate phenomenon.
Not for sale.welcomia / shutterstock
What might also be encouraging is a poll carried out by the Center for American Progress this year which showed around two-thirds of those who voted for Trump
opposed the idea of privatising or selling off America’s national
forests and public lands. Whether this is a strong enough basis for
there to be a rallying of the public is difficult to know. Nevertheless,
focusing on the local environment is a good start.
You, the expert
A focus on pollution might also actually open up the debate on the
environment and encourage some kind of grassroot reaction. Too often the
discourse on the environment and global warming has been dominated by
scientific experts and politicians. As such, the public might believe
that this is a matter of scientific debate that somehow they cannot
participate in, without some prior knowledge. After all, what can you,
personally, contribute to a debate on carbon dioxide parts-per-million,
or melting glaciers? Would you even know either was a problem if
scientists hadn’t warned us?
By contrast, feeling the effects of environmental pollution does not
require expert knowledge. The public can express remedial actions and
suggestions, without having to pretend that they understand atmospheric
science. Moreover, actions are more likely to be taken on a local level
if the focus is on local pollution.
The public should be scientists’ first ally in this battle. Any
language and issues that engage people against Trump’s climate folly in
whatever way should be the priority for scientists and policy makers
seeking to address the problem. Links
Government says law, which will include 40% renewables by 2025 and commitment to invest in new projects, will send a strong signal to investors
The Victorian renewable energy targets will rely on a reverse auction to
encourage the construction of new wind and solar projects.
Photograph: Pacific Hydro Limited
The Victorian government has introduced legislation to enshrine its
renewable energy targets in law and establish a reverse auction
mechanism to build 650 megawatts worth of new projects.
The premier, Daniel Andrews, announced the Victorian renewable energy targets (VRET) of 25% renewable energy by 2020 and 40% by 2025 in June 2016.
If Andrews can negotiate it past the upper house, the legislation introduced to parliament on Wednesday will make Victoria the first state to enshrine both its renewable energy targets and its commitment to invest in renewable energy in law.
That will send a strong signal to investors, environment minister
Lily D’Ambrosio said, and provide certainty for both the energy industry
and electricity consumers.
“These are ambitious yet achievable targets and this is the policy
certainty and it’s the right policy that industry has been deeply
searching for to make sure they can actually make the right decisions to
invest in our state,” D’Ambrosio said.
The VRET will rely on a reverse auction to encourage the construction
of new wind and solar projects in Victoria. D’Ambrosio said modelling
by the state government showed it would reduce household electricity
bills by $30 a year over the life of the scheme and drive a 16%
reduction in greenhouse gas emissions by 2034.
“In a pure economics sense more supply means cheaper prices and that’s what we will be modelling it on,” she said.
Leading experts agree that renewable energy is the cheapest form of new power generation, D’Ambrosio said.
Victoria has already held a limited reverse auction to commission two
new solar plants designed to power Melbourne’s tram network.
The successful tenders, announced on Wednesday, are the 100 megawatt
Bannerton Solar Park near Robinvale in north-west Victoria and a 38
megawatt solar farm at Numerka, near Shepparton.
D’Ambrosio said the new projects would provide 138 megawatts of solar
power and create jobs in regional areas. Expressions of interest for
the reverse auction for 650 megawatts of renewable energy power
generation – enough to power 389,000 homes or the combined residential
areas of Geelong, Ballarat, Bendigo and the Latrobe Valley – will open
in October.
Victoria has long been critical
of the Turnbull government’s commitment to a clean energy target and
threatened to work around government “indecision”. The current federal
renewable energy target expires in 2020.
“What we know is that in the absence of policy certainty and
leadership in Victoria it’s up to states like Victoria to fill that
void, to make sure that we’re doing everything that we can to drive the
transition that is incredibly important,” Andrews said.
Environmental
groups praised the decision, saying it led the way for other states and
territories to enshrine their own targets in legislation and send a
strong message they were transitioning away from fossil fuel power.
The Australian Conservation Foundation climate change campaigner,
Suzanne Harter, said leadership was particularly important because of a
“policy paralysis at a federal level”.
“The mechanism that the Victorian government is using is a tried and
true mechanism,” Harter said. “Coupled with the targets, it sends clear
signals to investors and to the sector.”
The Environment Victoria campaigns manager, Nicholas Aberle, said the
legislation showed the promise to get to 40% renewables was not an
“aspirational target”.
“It’s one thing to want more renewable energy but it’s another thing
to create a mechanism to make it happen,” he said. “The federal
government does not have the monopoly over energy policy and if they are
going to continue to not take climate change seriously then states are
going to step in.”
Aberle said new renewable energy projects would have to be spread
throughout Victoria to fit within the limits of the existing electricity
network and to provide energy security, preventing one severe weather
event from taking out the power for the whole state, as a storm did last year in South Australia.
Some places, like the Latrobe Valley, have significant unused transmission capacity because of the closure of the Hazelwood power station, making them an ideal site for windfarms.
In March the Andrews government announced a $20m tender to build 100mw of battery storage in Victoria by 2018,
in time to store power generated by the as yet commissioned renewable
energy plants. Three months later, Tesla founder Elon Musk committed to
build in South Australia the world’s largest lithium ion battery to store renewable energy.
Aberle said the speed with which battery technology was developing had put the goal of 100% renewable energy within reach.
“This is a really disruptive technology that’s going to completely
reshape what our energy sector looks like in the future,” he said. “It’s
going to shape it in a really positive way because it’s going to allow
us to get to 100% renewable energy much more quickly.
Kelp plants grow on a 30-foot-long, white PVC pole suspended in the water. If this is successful, instead of just one row, there would be a whole platform, hundreds of meters across and hundreds of meters deep, full of kelp plants. Courtesy of David Ginsburg/Wrigley Institute
The push for renewable energy in the U.S. often focuses on
well-established sources of electricity: solar, wind and hydropower. Off
the coast of California, a team of researchers is working on what they
hope will become an energy source of the future — macroalgae, otherwise
known as kelp.
Diane Kim is the associate director of special projects and the director of undergraduate programs at The Wrigley Institute for Environmental Studies. She is one of the researchers who runs the kelp elevator project. Monika Evstatieva/NPR
The Pacific Coast is known for its vast kelp forests. It's one of the
fastest-growing plants on Earth, and farming it requires no fertilizer,
fresh water, pesticides, or arable land. "It can grow 2 to 3 feet per
day," says Diane Kim, one of the scientists running the kelp research
project at the University of Southern California.
Kelp is
transformed into biofuel by a process called thermochemical
liquefaction. The kelp is dried out, and the salt is washed away. Then
it's turned into bio-oil through a high-temperature, high-pressure
conversion process.
Some small companies are growing kelp as a substitute for kale
in the U.S., but that's exactly the problem – very, very few are doing
it. Thus, the infrastructure and investment isn't in place to make other
products from kelp, like biofuel.
"We're testing out a concept
that would enable large-scale, open-ocean farming," she says. "And what
that would essentially do is grow enough kelp to make it economically
feasible to make it cost competitive and maybe one day, provide a source
of clean, sustainable, non-polluting source of energy to compete with
fossil fuels."
Twenty-five miles from downtown Los Angeles, on
sunny Catalina Island, Kim and her colleagues operate a center called
the Wrigley Institute of Environmental Studies. The clean, deep waters
off the island provide a great environment for research.
The Wrigley Marine Science Center is located 20 miles off the coast of Los Angeles, on Santa Catalina Island. Monika Evstatieva/NPR
Harvesting kelp in California for commercial purposes is not
unprecedented. "They did have these large boats that gave the kelp a
haircut, harvesting kelp along the California coast," Kim explains.
During World War I, kelp was used to make gunpowder. By the 1960s, a
company in San Diego harvested kelp to make products like alginate,
which is a solidifying agent in ice cream and cosmetics.
Here on Catalina Island, Kim and her colleagues are trying
to build a machine that would raise and lower kelp beds to get sunlight
in the shallow water and nutrients in the deep water. This would allow
them to farm miles from shore. They call the device a "kelp elevator."
There are real obstacles to creating large-scale kelp farms in the U.S., though.
"At
the moment, they're way behind the curve," says University of Hawaii
tenured researcher Michael Cooney of the Hawaii Natural Energy
Institute. He says countries in Asia and Scandinavia are much farther
along than the U.S.
One of the main reasons for this discrepancy is that these countries
have been growing kelp for food for many years. "They already have a
pre-existing infrastructure that's pretty sophisticated for growing and
harvesting," Cooney explains. "It's harvesting for food and other
products, but a lot of that capital's already in place. And that's a
much better starting point than small companies in the U.S. that try to
go from ground zero to a transportation fuel."
In Sweden,
people have been farming seaweed for a long time. "The first thing we do
with the high-quality kelp, we do it for food, actually, "says Fredrik
Grondahl of the Royal Institute of Technology in Stockholm. He says
selling kelp for food is very profitable.
The researchers don't use the natural populations of
kelp on Catalina Island, but grow their own in a nursery starting from
spores, like this one at the research facility. Anjuli Sastry/NPR
"The next part is to
make feed ingredients," Grondahl adds. "And then we are also extracting
polymers from the kelp to do bioplastics and adhesives and maybe also
textiles." The leftover kelp is turned into biofuel, so the clean energy
aspect is just one of many uses for kelp in Scandinavia.
The
Wrigley Institute scientists don't use natural populations of kelp, but
grow their own in a nursery, starting from spores. They tie the juvenile
kelp to long, white PVC pipes and drop them into the water. Eventually
they hope to create sheets of kelp plants hundreds of yards across.
Ken Nealson, director of the Wrigley Institute, takes us out onto the
water in a boat to see the test site where they've already dropped a
pipe 30 feet below the surface, with small kelp plants sprouting off of
it. Nealson straps on scuba gear and dives down to inspect the project,
while bass and other marine life circle around him.
"What you
see here is the beginning of something that can really revolutionize
bio-fuel production, if it works on a large scale," he explains. "You
can imagine growing enough kelp to supply a percentage of the bioenergy
that's needed in this country."
"Imagine" is the key word here.
This experiment is in its earliest stages. By September, the
researchers hope to put a full-scale kelp elevator in the water. And if
that works, then someday years from now, endless miles of ocean could
one day become farmland. Links
In this June 15, 2017, photo, research technician
Kristen Mello shows a sample of a red shrub-like seaweed collected in
the waters off Appledore Island, Maine. Kelp forests are critical to the
fishing industry but are disappearing around the world. The Gulf of
Maine is the latest global hotspot to lose kelp. Scientists say the
likely culprits are climate change and invasive species. (AP
Photo/Charles Krupa)
When diving in the Gulf of Maine a few years back, Jennifer Dijkstra
expected to be swimming through a flowing kelp forest that had long
served as a nursery and food for juvenile fish and lobster.
But Dijkstra, a University of New Hampshire
marine biologist, saw only a patchy seafloor before her. The sugar kelp
had declined dramatically and been replaced by invasive, shrub-like
seaweed that looked like a giant shag rug.
"I remember going to some dive sites and honestly being shocked at how few kelp blades we saw," she said.
The Gulf of Maine, stretching from Cape Cod to Nova Scotia, is the
latest in a growing list of global hotspots losing their kelp, including
hundreds of miles in the Mediterranean Sea, off southern Japan and
Australia, and parts of the California coast.
Among the world's most diverse marine ecosystems, kelp forests are found
on all continental coastlines except for Antarctica and provide
critical food and shelter to myriad fish and other creatures. Kelp also
is critical to coastal economies, providing billions of dollars in
tourism and fishing.
The likely culprit for the loss of kelp, according to several scientific studies, is warming oceans from climate change, coupled with the arrival of invasive species.
In Maine, the invaders are other seaweeds.
In Australia, the Mediterranean and Japan, tropical fish are feasting on the kelp.
Most kelp are replaced by small, tightly packed, bushy seaweeds that
collect sediment and prevent kelp from growing back, said the University
of Western Australia's Thomas Wernberg.
"Collectively these changes are part of a recent and increasing global
trend of flattening of the world's kelp forests," said Wernberg,
co-author of a 2016 study in the Proceedings of the National Academy of
Sciences, which found that 38 percent of kelp forest declined over the
past 50 years in regions that had data.
Kelp losses on Australia's Great Southern Reef threaten tourism and
fishing industries worth $10 billion. Die-offs contributed to a 60
percent drop in species richness in the Mediterranean and were blamed
for the collapse of the abalone fishery in Japan.
"You are losing habitat. You are losing food. You are losing shoreline
protection," said University of Massachusetts Boston's Jarrett Byrnes,
who leads a working group on kelp and climate change. "They provide real
value to humans."
The Pacific Coast from northern California to the Oregon border is one
place that suffered dramatic kelp loss, according to Cynthia Catton, a
research associate at the Bodega Marine Laboratory at the University of
California, Davis. Since 2014, aerial surveys have shown that bull kelp
declined by over 90 percent, something Catton blamed on a marine heat
wave along with a rapid increase in kelp-eating sea urchins.
Without the kelp to eat, Northern California's abalone fishery has been harmed.
"It's pretty devastating to the ecosystem as a whole," Catton said.
"It's like a redwood forest that has been completely clear-cut. If you
lose the trees, you don't have a forest."
Kelp is incredibly resilient and has been known to bounce back from storms and heat waves.
But in Maine, it has struggled to recover following an explosion of
voracious sea urchins in the 1980s that wiped out many kelp beds. Now,
it must survive in waters that are warming faster than the vast majority
of the world's oceans — most likely forcing kelp to migrate northward
or into deeper waters.
"What the future holds is more complicated," Byrnes said. "If the Gulf
of Maine warms sufficiently, we know kelp will have a hard time holding
on."
On their dives around Maine's Appledore Island, a craggy island off New
Hampshire that's home to nesting seagulls, Dijkstra and colleague Larry
Harris have witnessed dramatic changes.
Their study, published by the Journal of Ecology in April, examined
photos of seaweed populations and dive logs going back 30 years in the
Gulf of Maine. They found introduced species from as far away as Asia,
such as the filamentous red seaweed, had increased by as much 90 percent
and were covering 50 to 90 percent of the gulf's seafloor.
They are seeing far fewer ocean pout, wolf eel and pollock that once
were commonplace in these kelp beds. But they also are finding that the
half-dozen invasive seaweeds replacing kelp are harboring up to three
times more tiny shrimp, snails and other invertebrates.
"We're not really sure how this new seascape will affect higher species
in the food web, especially commercially important ones like fish, crabs
and lobster," said Dijkstra, following a dive in which bags of invasive
seaweed were collected and the invertebrates painstakingly counted.
"What we do think is that fish are using these seascapes differently."
A detailed roadmap for 139 countries outlines a path to a future powered entirely by wind, water and solar energy.
Is a renewable-powered world by 2050 really possible? Paul Kennedy / Getty
Everybody wants to change the world. Few of us publish research detailing exactly how to do it.
Stanford’s Mark Z. Jacobson, who led a 2015 effort
to create a state-by-state plan for a US transition to 100% renewable
energy, has published similar research on a much larger scale, examining
scenarios in which 139 countries could be powered purely by wind, water
and solar (WWS) by the year 2050.
In scope and scale, the paper – published in the new energy journal Joule
– is a significant expansion on Jacobson’s prior work. It isn’t limited
to each country’s electricity sector – it examines the electrification
and decarbonisation of transportation, heating, cooling, industry,
agriculture, forestry and fishing. The authors chose the 139 countries,
which between them cover 99% of the world’s carbon emissions, because
the necessary energy data about them were available through the
International Energy Agency (IEA).
The study also examines reductions in total power demand resulting from
efficiencies found in electrification, net changes to electricity sector
jobs, reductions in air pollution deaths and costs, reductions in
climate change deaths and costs and the benefits of the decentralisation
of energy technology. The authors are careful to place this herculean effort and the resulting roadmap in context.
“Both
individuals and governments can lead this change. Policymakers don’t
usually want to commit to doing something unless there is some
reasonable science that can show it is possible, and that is what we are
trying to do,” says Jacobson. “We are not saying that there is only one
way we can do this, but having a scenario gives people direction.”
His
ideal policy outcome would see “governments in many countries of the
world commit to 100% clean, renewable energy in all sectors by 2050 with
80% by 2030”.
Few attempts to map out a potential route for
total decarbonisation attempt to do it on this scale, and as such, this
is likely to turn the heads of policymakers. But modelling is a
double-edged sword: forecasting the future invariably draws attempts at
rebuttal and interrogation of the complexities, uncertainties and
assumptions that are a necessary part of the exercise.
The devil in the detail
Jacobson’s
prior US-focused paper highlighted a tense contradiction within the
intermeshed spaces of policy, academia and analysis that span the
renewable energy sector. The paper was criticised in a follow-up published in the same journal, Proceedings of the National Academy of Sciences, which stated that Jacobson’s work “involves errors, inappropriate methods, and implausible assumptions” – triggering a back-and-forth through social and academic channels that lasted many weeks.
The
key gripe focused on assumed increases in the discharge rate of US
hydro power stations – considered, by respondents, to be unviable.
In
the new global study, Jacobson has addressed this criticism by assuming
dispatchable output is sourced from concentrating solar power with
thermal storage, batteries and other dedicated storage.
The study
also models the interplay between supply and demand in the electricity
grids of these countries by using a model to simulate estimated resource
availability (wind, water and sunlight), adding constraints (such as
competition among wind turbines), and load data for each country
simulated at a 30-second resolution for 50 years into the future. The
authors specifically exclude bioenergy, nuclear, fossil fuels with
carbon capture and natural gas from their models. These exclusions are
likely to be a driving element of subsequent debates, with critics
regularly citing the need for a bigger ‘toolbox’ to address climate
change.
Australia’s findings
The supplemental
information attached to Jacobson’s paper provides data about Jacobson’s
Australia-specific modelling, some of which is illustrated below.
Jacobson’s projected mix of energy sources in 2050 in a 100% renewable scenario. Ketan Joshi based on data from Jacobson et al., Joule (2017) LARGE IMAGE
Jacobson estimates that his proposed shift to 100% WWS power would
achieve savings of $11,393 per person per year by the year 2050.
“That
number is broken down into direct energy cost savings (~$500 per person
per year), health cost savings (~$800 per person per year), and avoided
2050 global climate cost savings (~$10,100)”, Jacobson told Cosmos.
“Given that a complete melting of all the ice worldwide would raise sea
levels 70 meters, flooding 7% of the world's land, I believe the
$10,000 per person is probably an underestimate.”
A recent review
authored by Australia’s chief scientist Alan Finkel, elaborating on a
blueprint for Australia’s electricity system, embarked on a similar (and
far narrower) future-modelling exercise. A key difference was the
continued presence of coal and gas in the system modelled by Finkel.
Chart from the Finkel report shows projected mix of energy sources up to 2050 with a clean energy target. From Finkel et al., Blueprint for the Future: Independent Review into the Future Security of the National Electricity Market LARGE IMAGE
Jacobson contends that this rate of change is not sufficient. “To
avoid 1.5 C global warming, we need 80% reduction of everything by 2030
and 100% by 2050. We think a faster acceleration is possible at
reasonable to low cost.”
Jacobson’s paper is designed to serve as
a vision for future, but even Finkel’s proposal for a far less
ambitious emissions reduction target has not been adopted several months
after it was proposed.
The hazards of the future
Mark Dyson, of the Rocky Mountain Institute, grapples with the hazards of forecasting the future in an accompanying commentary on the paper.
“Different authors with different assumptions and technique will
understandably find different ‘answers’ for long-term decarbonisation.
Yet most debate about particular conclusions misses the massive
uncertainty of the inputs that drive those answers.”
Detailed
modelling of 100% renewable scenarios are designed as tools for
inspiring policy action rather than strict instructions for altering
energy systems, and they are often successful to some degree. The study
is also likely inspire discussion and debate about the exclusion of
technologies like nuclear power and carbon capture and storage, about
specific responses to the technical nuances of modelling systems on this
scale, and of course about the perceived blending of boundaries between
academia and activism.