 |
| Citizens flee floods in Sri Lanka. Photo by trokilinochchi/Wikimedia Commons. |
Nongtdu, a Kashmiri resident, barely had time to rush to the third floor of her house before water burst through her gate and inundated the first and second floors. Nongtdu and her family survived, but unusually heavy monsoon rains in September 2014 triggered floods in India and Pakistan that claimed more than 500 lives. It was the year’s costliest catastrophe.
Those floods may have been the most dramatic of recent river floods, but the threat extends well beyond Southeast Asia. More people are affected by floods than by any other type of natural disaster. New analysis shows that approximately 21 million people worldwide are affected by river floods each year on average. That number could increase to 54 million in 2030 due to climate change and socio-economic development.
Quantifying and Visualizing River Floods Worldwide
The Aqueduct Global Flood Analyzer, a new online tool, quantifies and visualizes the reality of global flood risk. WRI co-developed the tool with four Dutch research organizations: Deltares, the Institute for Environmental Studies of the VU University Amsterdam, Utrecht University and PBL Netherlands Environmental Assessment Agency, supported by the Netherlands’ Ministry of Infrastructure and the Environment.
The Analyzer estimates current and future potential exposed GDP, affected population and urban damage from river floods for every state, country and major river basin in the world.
We ranked 164 countries by the number of people affected by river flooding. We found that the top 15 countries account for nearly 80 percent of the total population affected every year. These countries are all considered least developed or developing. Roughly 167,000 people in the United States, the highest-ranked high-income country, are affected every year.
River Flooding Affects GDP
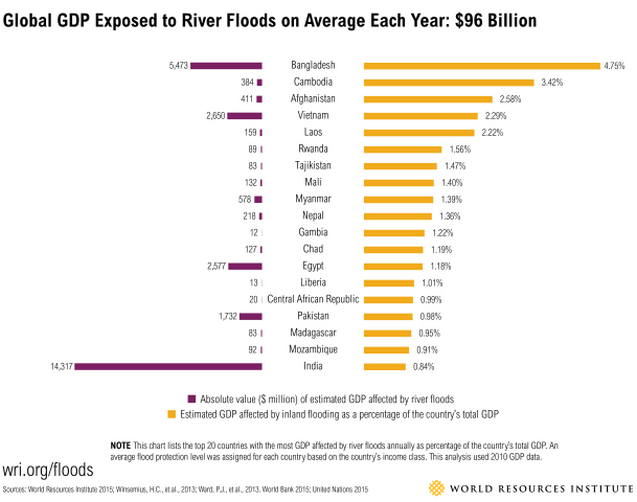
WRI analyzed which countries have the highest percentage of total GDP affected by river flooding on average per year, and each of the top 20 is classified as least developed or developing. India has by far the most GDP exposed, at $14.3 billion. Bangladesh is a distant second, at $5.4 million.
We judged the potential national economic consequences of river floods to be highest in countries with the largest percentage of affected GDP. China and Brazil, for example, would fall first and fifth respectively on a list ranked by gross GDP affected. However, their national incomes are so large that they drop off a list of countries ranked by percentage of GDP exposed.
GDP Exposure in 2030: Disparity between the Developed and Developing Countries
Our analysis shows a clear trend across the world. In lower and middle-income countries, socio-economic development is expected to concentrate more people, buildings, infrastructure and other assets in vulnerable regions. So, the developing world is expected to see more GDP exposed to flood risks in 2030, driven largely by socio-economic change.
India, for example, faces more potential change in exposed GDP than any other country. Using a middle-of-the road scenario, the Analyzer estimates that India’s current $14 billion in GDP exposed annually could increase more than 10-fold to $154 billion in 2030. Approximately 60 percent of that increase could be caused by socio-economic development.
In the developed world, Australia, Croatia, Finland, Portugal, and Israel are expected see more GDP exposed to floods in 2030, driven primarily by social-economic change. On the contrary, countries like the Netherlands, Slovenia, Belgium, Ireland, and Switzerland will likely see increased GDP exposure driven primarily by climate change.
Climate Change Will Expose More People to River Floods
Climate change is a greater driver of change in population exposure to river floods than socioeconomic development, because both the frequency and intensity of river floods is expected to increase due to climate change in many areas. This phenomenon would expand flood-prone areas, and make floods more likely to occur in those areas more often.
Climate change drives populations at risk in the developed and developing world alike – there is no clear distinguishing pattern. In Ireland, for example, 2,000 people face flood risks currently. By 2030, 48,500 more people could face river flood risk, and 87 percent of that difference would be driven by climate change. From the developing world, 715,000 people in Pakistan are at risk today. By 2030, river floods could affect 2 million more people, with climate change driving 70 percent of that increase.
A Tool for Awareness and Action
The risks may be escalating, but public and private sector decision makers can do more to prevent catastrophic damage before it happens.
Sharing the Analyzer’s easily accessible data with public and private sector decision makers will immediately raise their awareness about current and future river-flood risks. Armed with the right information, decision makers can then prioritize risk reduction and climate adaptation projects, and implement the most viable, cost-efficient options (see sidebar).
It will take decades and many billions of dollars to protect the tens of millions of people at risk from river floods and coastal storm surges. But starting now and following the direction of tools like the Global Flood Analyzer will help decision makers in international relief organizations, reinsurance companies, multinational companies, and many others build advanced protection systems to protect people and infrastructure.
Who Can Use the Flood Analyzer?
- International development and financing organizations like the World Bank can prioritize investments in promising natural disaster risk-reduction strategies.
- International natural disaster risk-reduction monitoring organizations like the United Nations Office for Disaster Risk Reduction can evaluate baseline risk conditions and monitor progress of risk reduction activities.
- (Re-) insurance companies can rapidly assess risk and projected risk trends across their portfolios and explain the importance of insurance to potential clients.
- Multinational companies can assess risks to their global manufacturing facilities and supply chains and prioritize locations for further analysis and risk mitigation actions.
For more on the ranking and methodology behind this analysis, access our data sets or test the tool.
Links


No comments :
Post a Comment