
The climate models used by scientists today rely on some of the world’s most advanced supercomputers. It can take dozens of highly skilled people to build and then operate a modern-day climate model.
However, less than a century ago, climate models were little more than an idea; basic equations roughly sketched out on paper. After the second world war, though, the pace of development quickened dramatically, particularly in the US.
By the late 1960s, policymakers were being presented with the models’ findings, which strongly reinforced the theory that the continued rise in human-caused greenhouse gas emissions would alter the global climate in profound ways.
Carbon Brief charts more than 50 key moments in the history of climate modelling. Such moments include:
- Guy Callendar’s seminal paper published in 1938.
- The first computerised, regional weather forecast in 1950.
- Norman Phillips’ first general circulation model in 1956.
- The establishment of a modelling group at the National Center for Atmospheric Research (NCAR) in Boulder, Colorado, in 1964.
- Syukuro Manabe and Richard Wetherald’s seminal climate modelling study in 1967.
- The Met Office’s first general circulation model in 1972.
- The Charney Report in 1979.
- James Hansen’s three scenarios published in 1988.
- The first Intergovernmental Panel on Climate Change (IPCC) report published in 1990.
- The Coupled Model Intercomparison Project (CMIP) launched in 1995.
- The IPCC’s fifth assessment report published in 2013.
 |
| Introduction to Geophysical Fluid Dynamics: Physical and Numerical Aspects. Credit: Archive.org |
Weather Prediction by Numerical Process
Richardson builds upon the earlier ideas of the Norwegian meteorologist, Vilhelm Bjerknes, who had argued at the turn of the 20th century that atmospheric changes could be calculated from a set of seven “primitive equations”.
Before them both, in 1895, the Swedish physical chemist Svante Arrhenius had described an energy budget model that considered the radiative effects of carbon dioxide in a paper presented to the Royal Swedish Academic of Sciences.
 |
| Guy Stewart Callendar in 1934. Credit: University of East Anglia |
Guy Callendar
Writing an appreciation of Callendar’s “classic” paper 75 years later in 2013, climate scientist Ed Hawkins writes: “What is most remarkable is that he did all the calculations by hand, without the aid of a computer…Callendar had managed to measure the temperature change of the planet, from his desk, to within the modern estimates of the uncertainties that exist.”
However, Callendar’s work is largely ignored until the 1960s.
 |
| John von Neumann. Credit: Wikimedia Commons |
1946
John von Neumann
John von Neumann, a Princeton mathematician who worked on the Manhattan Project during the second world war, proposes that new computers, such as the ENIAC at the University of Pennsylvania, be used to forecast weather. He attracts grants from the US military to develop his idea at Princeton. He says that if regional weather could be forecast then the whole of the atmosphere could one day be simulated.
 |
| ENIAC programmers, via computerhistory.org |
Electronic Numerical Integrator and Computer (ENIAC)
The group uses ENIAC to run the first computerised, regional weather forecast in 1950.
The 2D model divides the atmosphere into grid cells in the way Richardson had proposed.
But it still takes about 24 hours of computing to produce a 24-hour forecast – with mixed accuracy.
 |
| Offices of the US weather bureau. Credit: Paul Fearn/Alamy Stock Photo |
Joint Numerical Weather Prediction Unit
It is based in Washington DC and is tasked with developing operational forecasts.
By May of 1955, the unit is producing real-time forecasts in advance of the weather using an IBM 701 computer, but the accuracy is inconsistent.
By 1958, with advances in computing speeds, the unit is producing forecasts looking out several days.
December 1954
BESK
 |
| Credit: Liftarn/Wikimedia Commons. |
1955
General Circulation Research Section
 |
| Joseph Smagorinsky. NOAA |
 |
Mikhail Budyko. Credit World Meteorological Organization
|
1956
Mikhail Budyko
The seminal book influences climate scientists for many years with its method for calculating the various components of the heat balance of the entire Earth system. Using a simple energy-balance model, he calculates the Earth’s average global temperature by balancing incoming solar energy with outgoing thermal energy.
Budyko calls for “an accumulation of data on direct balance observations” from weather stations. Once this happens, he says, then it could “open up new vistas” for the “development of the theory of climate and general circulation of the atmosphere”.
 |
Syukuro Manabe. Credit: AIP Emilio Segrè Visual Archives
|
1956
Syukuro Manabe
Smagorinsky invites Syukuro Manabe from the University of Tokyo to join his lab at the US Weather Bureau. It proves to be a key moment, with Manabe’s work at GFDL now seen as a vital chapter in the history of climate modelling. Smagorinsky asks Manabe to oversee the coding and development of atmospheric GCMs at the lab. They work together to gradually add complexity to the models, such as the evaporation of rainfall and the exchange of heat across ocean, land and ice.
April 1956
First general circulation model
 |
| Quarterly Journal of the Royal Meteorological Society |
 |
| Journal of Geophysical Research. 1 July 1963 |
July 1963
Fritz Möller
1964
Akio Arakawa
 |
Akio Arakawa. Credit: UCLA
|
 |
| Akira Kasahara (left) and Warren Washington with his student, Brenda Chester (right) |
NCAR
 |
| Weather and Climate Modification Problems and Prospects |
January 7, 1966
National Academy of Science report
 |
Bryan and Cox (1967), Tellus
|
Kirk Bryan
An oceanographer based at GFDL called Kirk Bryan is the first to model a 3D circulation of the ocean. In conjunction with his colleague Michael Cox – and overseen by Manabe – Bryan publishes a paper in the journal Tellus entitled, “A numerical investigation of the oceanic general circulation”.
May 1, 1967
Manabe and Wetherald
 |
| Manabe and Wetherald (1967), Journal of the Atmospheric Sciences |
Along with his co-author Richard Wetherald, Manabe produces the first credible prediction, using a 1D radiative-convective model, of what would happen to the atmosphere if CO2 levels were changed. The paper is published in the Journal of the Atmospheric Sciences and entitled, “Thermal Equilibrium of the atmosphere with a given distribution of relative humidity”.Manabe and Wetherald specifically want to know what will happen to the global average temperature if the radiative transfer of energy between the surface and the troposphere is altered by an increase in CO2 levels. This is to become a central focus for climate modellers in the decades ahead. In addition, they want to know what the potential feedbacks from water vapour and clouds might be, which they discover strongly influence the CO2 effect. They estimate the effect of doubling CO2 levels – a metric which later becomes known as “climate sensitivity” – and settle on a value of 2.4C.
 |
| A Global Climatic Model Based on the Energy Balance of the Earth-Atmosphere System. Journal of Applied Meteorology and Climatology. |
March 4, 1969
William D Sellers
His paper, “A Global Climatic Model Based on the Energy Balance of the Earth-Atmosphere System”, is published in the Journal of Applied Meteorology and Climatology.
|
| A Global Climatic Model Based on the Energy Balance of the Earth-Atmosphere System. Journal of Applied Meteorology and Climatology. |
April 14, 1969
Nimbus III
However, the era of climate scientists relying on satellite data to test and validate their models has begun. Climate scientists will come to rely on satellites to carry instruments, such as microwave-sounding units, into orbit.
 |
| From S. Manabe and K. Bryan, J. Atmospheric Sciences 26 (1969): 786-89 , p. 786 |
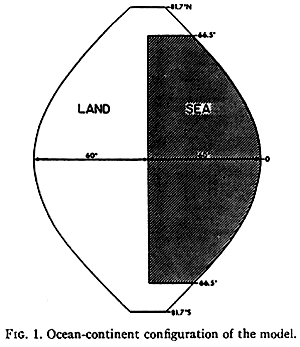
Manabe and Bryan
However, the computing time needed to model the ocean elements is considerable and truly tests their Univac 1108 computer. It takes 1,100 hours (about 46 days) to do just one run of the model. They are forced to use a highly simplified view of “Earth”, where a globe is split into three sections, equal parts ocean and land, with the poles omitted. Their paper (pdf) is published in the Journal of the Atmospheric Sciences and entitled, “Climate calculations with a combined ocean-atmosphere model”.
July 1970
Study of Critical Environmental Problems
 |
Williams College, Massachusetts. Credit: Daderot / Wikimedia Commons
|
The report is criticised as being too US-centric and a follow-up, three-week meeting involving participants from 14 countries is organised in Stockholm in 1971. The resulting output is called “Inadvertent Climate Modification: Report of the Study of Man’s Impact on Climate” (SMIC).
Joseph Smagorinsky attends both meetings. Suki Manabe and Mikhail Budyko attend the SMIC meeting. The climate change working group at both meetings is led by NCAR’s William Kellogg. Global climate models are presented as being “indispensable” for researching human-caused climate change.
The SCEP and SMIC reports both influence the landmark June 1972 meeting, also held in Stockholm, called the United Nations Conference on the Human Environment, which leads to the founding of the UN Environment Program. Human-caused climate change is now on the radar of politicians.

October 3, 1970
NOAA
With the support of President Richard Nixon, a “wet NASA” is created. It is called the National Oceanic and Atmospheric Administration, or NOAA, and sits within the US Department of Commerce. Nixon says it should “serve a national need for better protection of life and property from natural hazards…for a better understanding of the total environment”. This reflects a burgeoning interest – and concern – at this time about the way humans are impacting the environment. NOAA becomes one of the world’s leading centres of climate change research, with GFDL at Princeton being one of its key research centres.
October 1972
Met Office climate model
 |
| George Corby. Credit: G. A. Corby/Met Office |
Using the UK-based ATLAS computer (considered at the time to be the world’s fastest supercomputer), the team, led by George Corby, use their five-layer model to show in a follow-up paper in 1973 that “despite the deterioration in the upper part of the model, reasonable simulation was achieved of many tropospheric features…There were also, however, a number of things that were definitely incorrect.”
The Met Office becomes one of the world’s leading centres of climate modelling in the decades ahead.
 |
Manabe and Weatherald, 1975. Journal of the Atmospheric Sciences
|
January 1, 1975
Doubling of CO2
 |
Manabe, Bryan and Spelman, 1975. Journal of Physical Oceanography
|
First coupled ocean-atmosphere GCM
The paper is entitled, “A Global Ocean-Atmosphere Climate Model. Part I. The Atmospheric Circulation” and published by the Journal of Physical Oceanography.
1975
Understanding Climatic Change: A Program for Action
 |
Understanding Climatic Change - A Program for Action. National Academy of Sciences
|
GARP had been tasked in 1972 with producing a plan for how best to respond to the increasing realisation that “man’s activities may be changing the climate”. GARP “strongly recommends” that a “major new program of research”, with “appropriate international coordination”, is needed to “increase our understanding of climatic change and to lay the foundation for its prediction”. To support this, it also recommends the development of a “wide variety” of models, accepting that realistic climate models "may be considered to have begun”.
 |
Layers of Earth's atmosphere. Credit: Stocktrek Images, Inc. / Alamy Stock Photo
|
Modelling methodologies published
 |
| Ad Hoc Study Group on Carbon Dioxide and Climate. National Academy of Sciences, 1979 |
The Charney Report
1980
World Climate Research Programme

The International Council of Scientific Unions and the World Meteorological Organization unite to sponsor the launch of the World Climate Research Programme (WCRP). Its main objective is “to determine the predictability of climate and to determine the effect of human activities on climate”. WCRP, which is based in Geneva, helps to organise observational and modelling projects at an international scale. Within a few years, its work helps to establish the understanding and prediction of El Niño and its associated impact on the global climate. It also leads to much better quality data collection of oceans which, in turn, helps climate modellers.
1983
Community Climate Model
NCAR’s Stephen Schneider and William Kellogg talking about climate models in a 1981 TV documentary. |
 |
| Projecting the climatic effects of increasing carbon dioxide. United States Department of Energy, Dec 1985 |
US Department of Energy report
The volume concludes: “Although papers continue to be published indicating order-of-magnitude shortcomings of model results, when these arguments have been carefully considered, they have been found to be based on improper assumptions or incorrect interpretations. Although the models are by no means perfect, where it has generally been possible to compare large-scale results from model simulations with measurements, the agreement has been good.”
 |
| Hansen et al, Journal of Geophysical Research, 1988 |
Hansen’s three scenarios
Two months earlier, Hansen includes the paper’s finding in his now-famous US Senate hearing where he explains that human-caused global warming “is already happening now”. 1988 was, at that time, the warmest year on record.
 |
Bert Bolin. Credit: KVA
|
November 1988
IPCC established
1989
The Atmospheric Model Intercomparison Project launches
 |
| Lawrence Livermore National Laboratory. Credit: National Ignition Facility / Wikimedia Commons |
AMIP is centred at the Program for Climate Model Diagnosis and Intercomparison at the Lawrence Livermore National Laboratory in California, but is a genuinely international attempt to standardise the assessment of the world’s various climate models.
June 1989
New AOGCMs
 |
Ronald Stouffer. Credit: John Mitchell
|
Five months later, a paper in Nature by a team at the Geophysical Fluid Dynamics Laboratory at Princeton (led by Ronald Stouffer, but including Manabe and Bryan) sets out their AOGCM results, which highlight “a marked and unexpected interhemispheric asymmetry”. It concludes: “In the Northern Hemisphere of the model, the warming of surface air is faster and increases with latitude, with the exception of the northern North Atlantic.”
 |
Margaret Thatcher opens the Met Office Hadley Centre. Credit: Met Office
|
Met Office Hadley Centre opens
The first Hadley Centre coupled model boasts “11 atmospheric levels, 17 ocean levels and 2.5° × 3.75° resolution”. The Hadley Centre, now located in Exeter, remains to this day one of the world’s leading climate modelling centres.
August 27, 1990 — August 30, 1990
First IPCC report
 |
First IPCC report. Credit: IPCC
|
The report carefully explains: “The most highly developed tool which we have to predict future climate is known as a general circulation model or GCM. These models are based on the laws of physics.” It says it has confidence in the models because “their simulation of present climate is generally realistic on large scales”.
But there’s a note of caution: “Although the models so far are of relatively coarse resolution, the large scale structures of the ocean and the atmosphere can be simulated with some skill. However, the coupling of [these] models reveals a strong sensitivity to small-scale errors which leads to a drift away from the observed climate. As yet, these errors must be removed by adjustments to the exchange of heat between ocean and atmosphere.”
September 20, 1990
Clouds
 |
Credit: Unsplash
|
They say their paper “emphasises the need for improvements in the treatment of clouds in these models if they are ultimately to be used as reliable climate predictors”. It follows a similar paper by Cess et al published a year earlier in Science. Together, the papers illustrate how climate scientists from across many countries are now working collectively to improve and refine their models. Clouds remain to this day a challenge for climate modellers.
June 15, 1991
Eruption of Mount Pinatubo
 |
| Mount Pinatubo erupts, Luzon, Philippines. Credit: David Hodges / Alamy Stock Photo |
Over the coming years, climate models show that they can indeed accurately predict what impact the aerosols thrown into the atmosphere by Mount Pinatubo and other large volcanic eruptions can have, with the model results closely matching the observed brief period of global cooling post-eruption.
 |
| Image: Richinpit/E+/Getty Images |
Climate System Modeling' published
1995
CMIP launched

Building on the development and success of AMIP in 1989, the World Climate Research Programme (WCRP) initiates the Coupled Model Intercomparison Project (CMIP). It aims to create a “standard experimental protocol” for studying the output of coupled atmosphere-ocean GCMs (AOGCMs) and, in particular, how they project climate change in the decades ahead.
The global community of modellers use CMIP to perform "control runs" where the climate forcing is held constant. In total, 18 models from 14 modelling groups are included. They compare how the various models “output” an idealised scenario of global warming, with atmospheric CO2 increasing at the rate of 1% per year until it doubles at about Year 70.
CMIP, which is currently on its sixth iteration, is still a bedrock of climate modelling today.
August 10, 1995
Aerosols
 |
| Fig 4 from John Mitchell's paper. Credit: Mitchell et al/Nature |
Mitchell’s paper builds on earlier work showing how rising quantities of aerosols might affect radiative forcing. For example, Science had published a much-discussed paper in 1971 by Ichtiaque Rasool and Stephen Schneider, both then at NASA GISS, entitled “Atmospheric carbon dioxide and aerosols: Effects of large increases on global climate”. It concluded: “An increase by only a factor of 4 in global aerosol background concentration may be sufficient to reduce the surface temperature by as much as 3.5K. If sustained over a period of several years, such a temperature decrease over the whole globe is believed to be sufficient to trigger an ice age.”
September 10, 1995
Draft of IPCC’s second assessment report
 The New York Times reports that it has obtained a draft of the IPCC’s second report. The newspaper says the IPCC, in “an important shift of scientific judgment”, has concluded that “human activity is a likely cause of the warming of the global atmosphere”.
However, much of the newspapers’ focus is on the IPCC’s assessment of the accuracy of climate models’ projections: “The models have many imperfections, but the panel scientists say they have improved and are being used more effectively.”
The paper notes that the scientists’ confidence has been “boosted by more powerful statistical techniques used to validate the comparison between model predictions and observations”. However, it says “despite the new consensus among panel scientists, some skeptics, like Dr Richard S Lindzen of the Massachusetts Institute of Technology, remain unconvinced”. Lindzen is quoted as saying that IPCC's identification of the greenhouse signal "depends on the model estimate of natural variability being correct". Models do not reflect this well, he says.
 |
Credit: US Government Printing Office, archive.org
November 16, 1995
|
US Congressional hearing into climate models
A “balance” of expert witnesses is called to give evidence. They include the climate sceptic Pat Michaels and UK climate scientist Bob Watson, who later becomes the IPCC chair. Rohrabacher says he wants to “promote dialogue” among the witnesses due to the “controversy” over the “reliability” of climate models. He asks: “Are we so certain about the future climate changes that we should take action that will change the lives of millions of our own citizens at a cost of untold billions of dollars?”
The event sets the tone and template for many other similar hearings on the Hill in the years ahead.
July 4, 1996
Santer’s ‘fingerprint’ study
 |
| Ben Santer in the film Merchants of Doubt, 2014. Credit: Everett Collection Inc / Alamy Stock Photo |
This attribution study – sometimes called a “fingerprint” study – comes just months after the IPCC’s second assessment report had concluded that “the balance of evidence suggests that there is a discernible human influence on global climate”. Santer had been a key author for the chapter that shaped that wording. That statement – and Santer et al’s Nature paper – are both aggressively attacked by climate sceptics, but later substantiated by scientists.
March 15, 2000
IPCC’s Special Report on Emissions Scenarios
 |
| Professor Nebojsa Nakicenovic. Credit: Silveri/IIASA |
In 2000, the IPCC publishes a special report on emissions scenarios (SRES): “They include improved emission baselines and latest information on economic restructuring throughout the world, examine different rates and trends in technological change and expand the range of different economic-development pathways, including narrowing of the income gap between developed and developing countries.”
The IPCC team is led by Nebojsa Nakicenovic of the International Institute for Applied Systems Analysis (IIASA) in Austria. The SRES are used for the IPCC’s third assessment report in 2001, but are later further developed into the Representative Concentration Pathways (RCPs) in time for the IPCC’s fifth assessment report in 2014.
November 9, 2000
Carbon cycle included in climate models
 |
| Horse-chestnut tree. Credit: imageBROKER / Alamy Stock Photo |
The scientists couple a dynamic global vegetation model – called “TRIFFID” – with an ocean-atmosphere model and an ocean carbon-cycle model. Adding TRIFFID means that soil carbon and “five functional types” of plant (“broadleaf tree, needleleaf tree, C3 grass, C4 grass and shrub”) are included in climate models for the first time.
October 5, 2004
‘Extreme event’ attribution study
 |
| Summer heatwave in Paris. Credit: Idealink Photography/ Alamy Stock Photo |
Stott and Allen do not try to establish whether human-caused emissions “caused” the extreme heatwave. Rather, they use modelling to show probabilistically that emissions raised the chances of the heatwave occuring. The paper triggers many more extreme event attribution studies, many of which are performed in near-realtime so the results can be published days after the actual event.
December 5, 2007
Santer vs Douglass
 |
| University of Rochester. Credit: Peter Steiner/Alamy Stock Photo |
Ten months later, a diverse group of climate modellers, led by Ben Santer, publish a paper in response in the same journal. It concludes: “This claim was based on use of older radiosonde and satellite datasets, and on two methodological errors: the neglect of observational trend uncertainties introduced by interannual climate variability, and application of an inappropriate statistical ‘consistency test’.”
Santer and his colleagues then become the focus of a coordinated campaign, which includes repeated freedom of information requests for their code, emails and data. The episode is further inflamed by the “Climategate” affair in 2009, when stolen emails sent by climate scientists are selectively quoted by climate sceptics and media in an attempt to undermine climate science.
The “Santer vs Douglass” episode typifies the way climate sceptics have sought to undermine and criticise climate modelling since at least the early 1990s.
February 12, 2008
Tipping elements
 |
| A collapsing ice shelf - Larsen B in 2005. Credit: NASA Earth Observatory |
The paper lists six tipping elements it believes are of “policy relevance”, should emissions continue to rise: reorganisation of the Atlantic thermohaline circulation; melting of the Greenland ice sheet; disintegration of the West Antarctic ice sheet; Amazon rainforest dieback; dieback of boreal forests; and shift of the El Niño-Southern Oscillation regime to an El Niño-like mean state.
The paper offers a stark conclusion: “Society may be lulled into a false sense of security by smooth projections of global change. Our synthesis of present knowledge suggests that a variety of tipping elements could reach their critical point within this century under anthropogenic climate change. The greatest threats are tipping the Arctic sea-ice and the Greenland ice sheet.”
March 23, 2008
Black carbon
 |
| Flames leak from a gas/oil pipe on the edge of the Sahara desert, Libya. Credit: Purple Pilchards / Alamy Stock Photo |
“Aerosols in aggregate are either acting to, you could say, cool the atmosphere or mask the effect of CO2,” Carmichael tells the Guardian. “[Black carbon] is the only component of this aerosol mix that in and of itself is a heating element.” The authors argue that the impact of black carbon has, to date, been underestimated by the models.
September 22, 2008 — September 24, 2008
CMIP5
 |
| Ecole Normale Superiéure, Paris. Credit: Photo 12/Alamy Stock Photo |
CMIP5 includes decadal predictions (both hindcasts and projections), coupled carbon/climate model simulations, as well as several diagnostic experiments used for understanding longer-term simulations out to 2100 and beyond.
September 7, 2012
A National Strategy for Advancing Climate Modeling
 |
| NASA's visualisation of CO2 emissions in 2006. Credit: NASA |
September 23, 2013 — September 27, 2013
IPCC’s fifth assessment report
 |
| Stockholm, Sweden, 2013. Credit: Arseniy Rogov/Alamy Stock Photo |
This recent “observed reduction in surface warming trend” – sometimes labelled as a “slowdown” or, inaccurately, as a “pause” or “hiatus” – subsequently becomes a focus of study for climate modellers. Four years later, a paper published in Nature in 2017 seeks to “reconcile the controversies” and concludes that a “combination of changes in forcing, uptake of heat by the oceans, natural variability and incomplete observational coverage” were to blame. The authors state that, as a result of their findings, “we are now more confident than ever that human influence is dominant in long-term warming”.
Reflecting new understanding of radiative forcings, AR5 also slightly adjusts the IPCC’s range of equilibrium climate sensitivity to “1.5C to 4.5C (high confidence)”. It adds: “The lower temperature limit of the assessed likely range is thus less than the 2C in the AR4, but the upper limit is the same.”
October 6, 2017 — October 10, 2017
IPCC’s sixth assessment report
 |
| Valerie Masson-Delmotte, co-chair of Working Group I, at the 46th Session of the Intergovernmental Panel on Climate Change, 6 September 2017. |
Links
No comments :
Post a Comment