
Large chunks of Queensland are expected to vanish underwater as sea levels threaten the state. A “realistic” report shows 55 suburbs and hotspots will disappear. Full list of suburbs and when it’s expected to occur revealed.

|
The Coastal Risk Australia Map paints a dire picture for some of the Sunshine State’s most iconic locations based on findings from the Intergovernmental Panel on Climate Change Fifth Assessment Report.
|
|
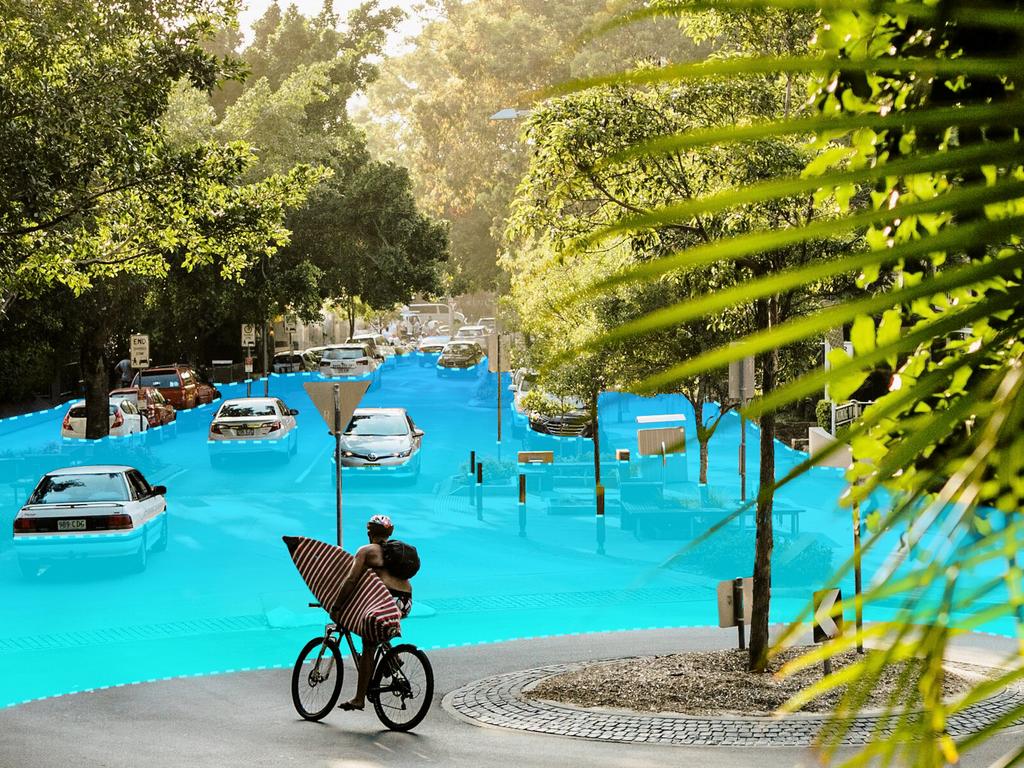
An artist’s impression of what Hasting Street in Noosa would look
like under the modelling for a 0.84m rise in sea levels. |
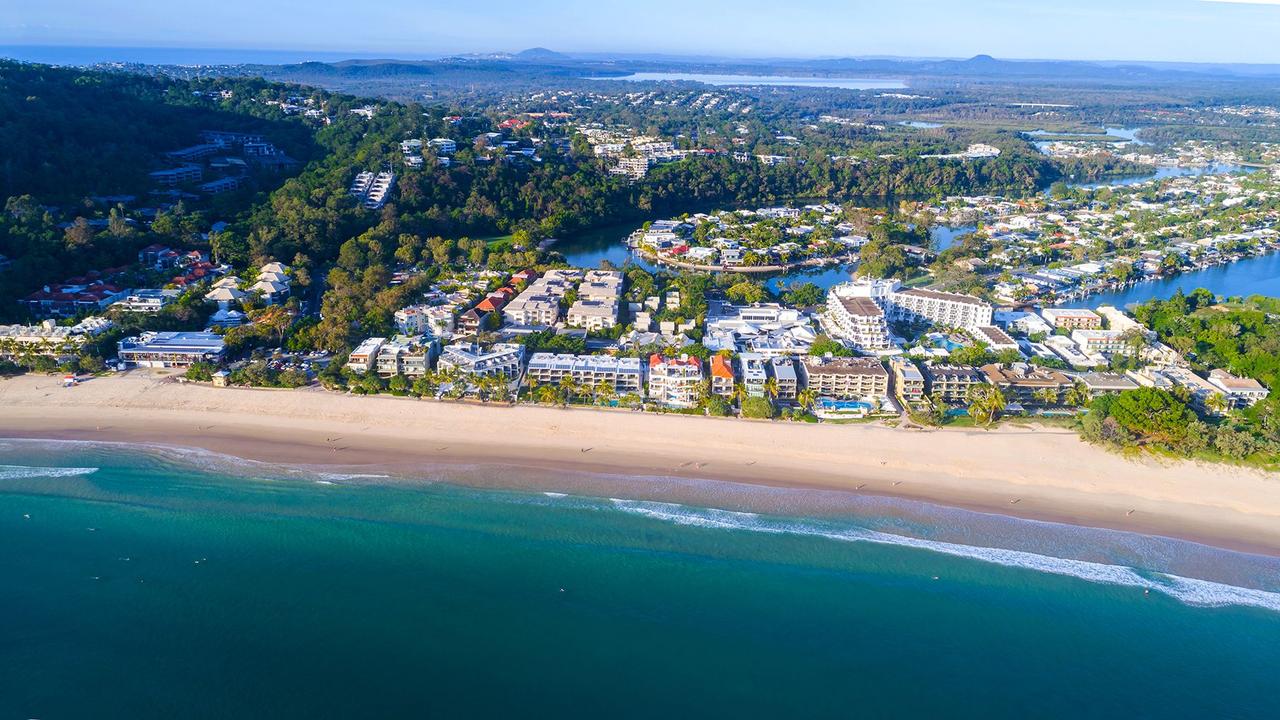
NOOSA
|
|
Main Beach, Hastings Street and the canals of Noosa are all facing
a grim future under the modelling. |
|
|
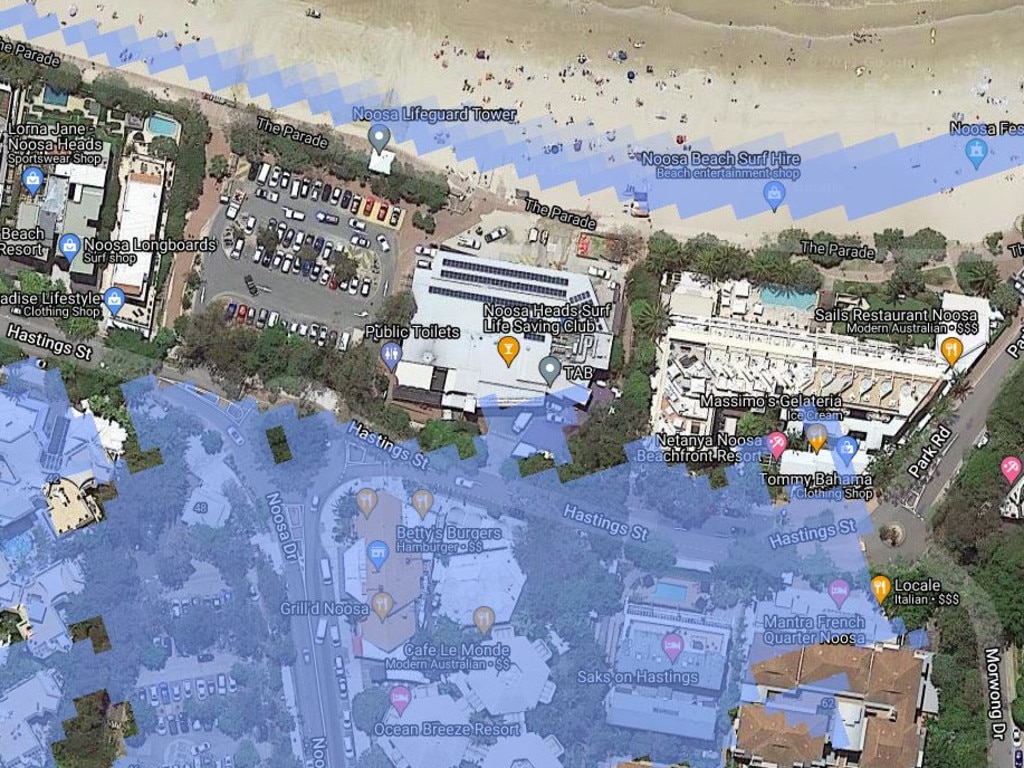
Hastings Street in 2100 as depicted by the Coastal Risk Australia
Map. |
“Like any modelling there is no guarantee the scenario will eventuate, but based on available information it is realistic scenario if no mitigation is undertaken.”
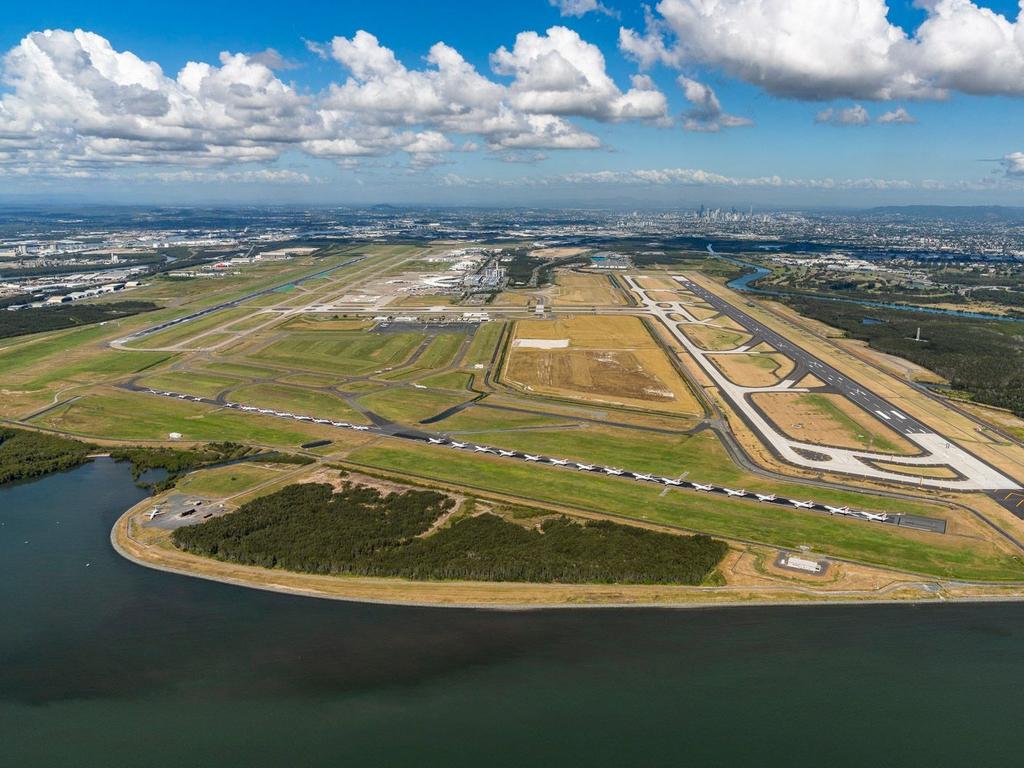
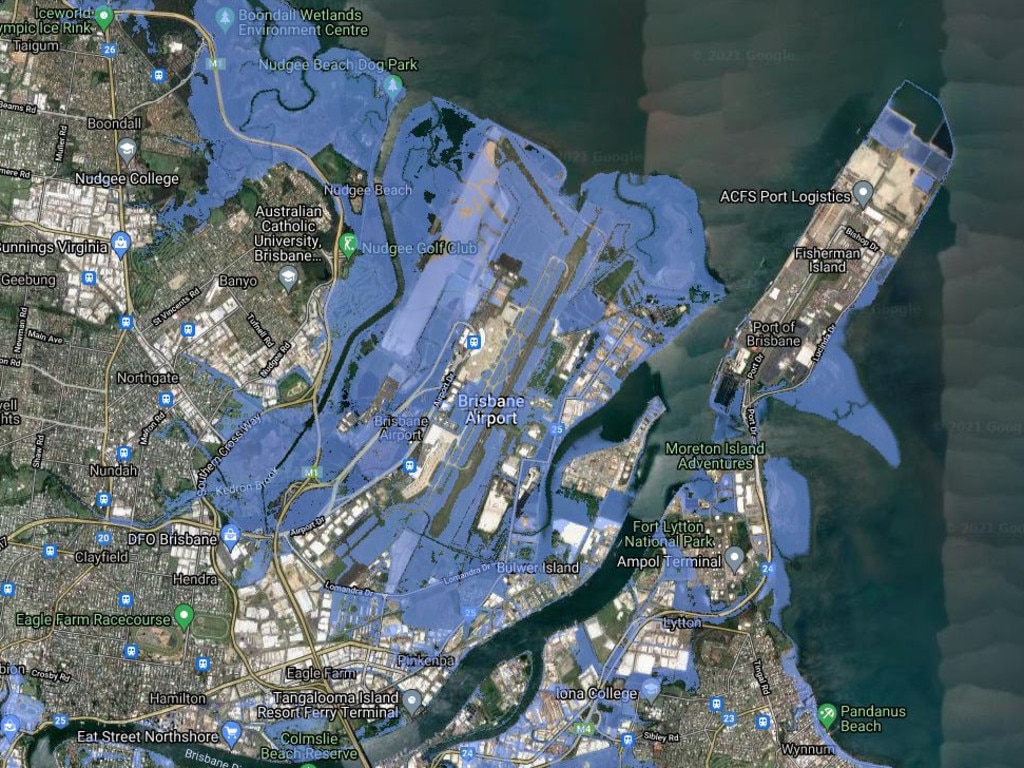
BRISBANE AIRPORT
|
|
The areas around Brisbane Airport and the port face inundation. |
|
|
Brisbane Airport in 2100 as depicted by the Coastal Risk
Australia Map. |
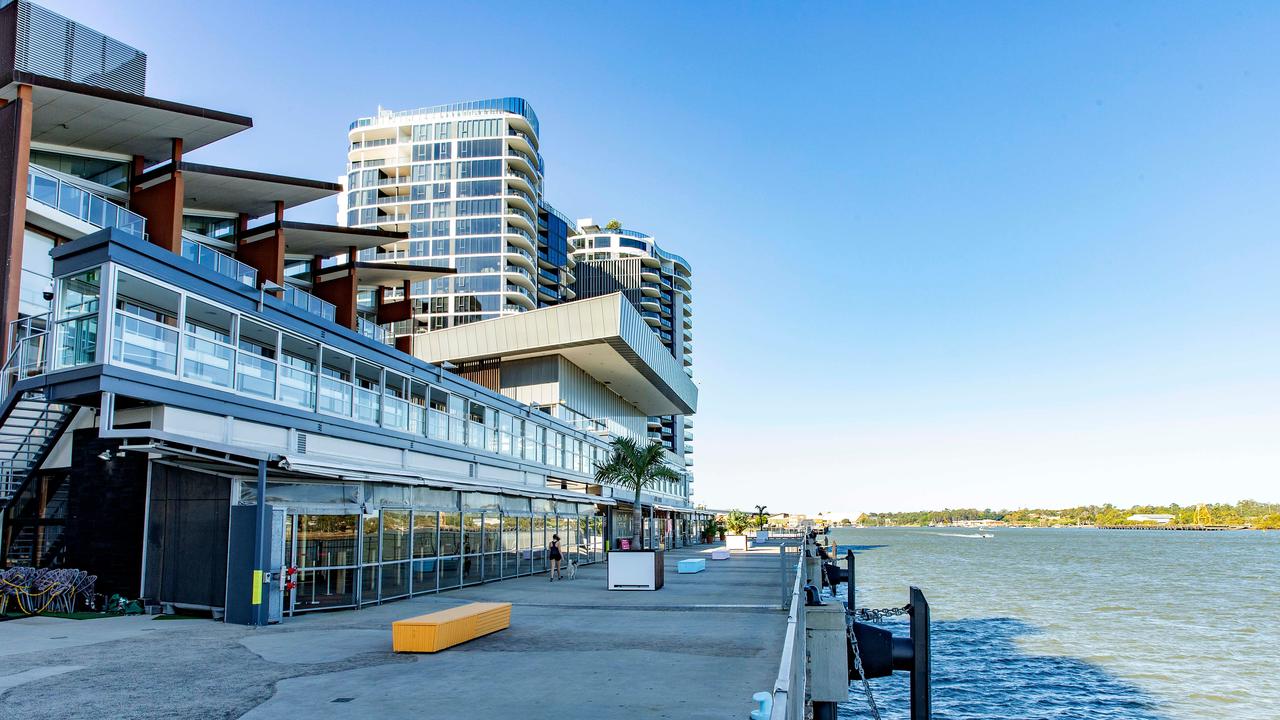
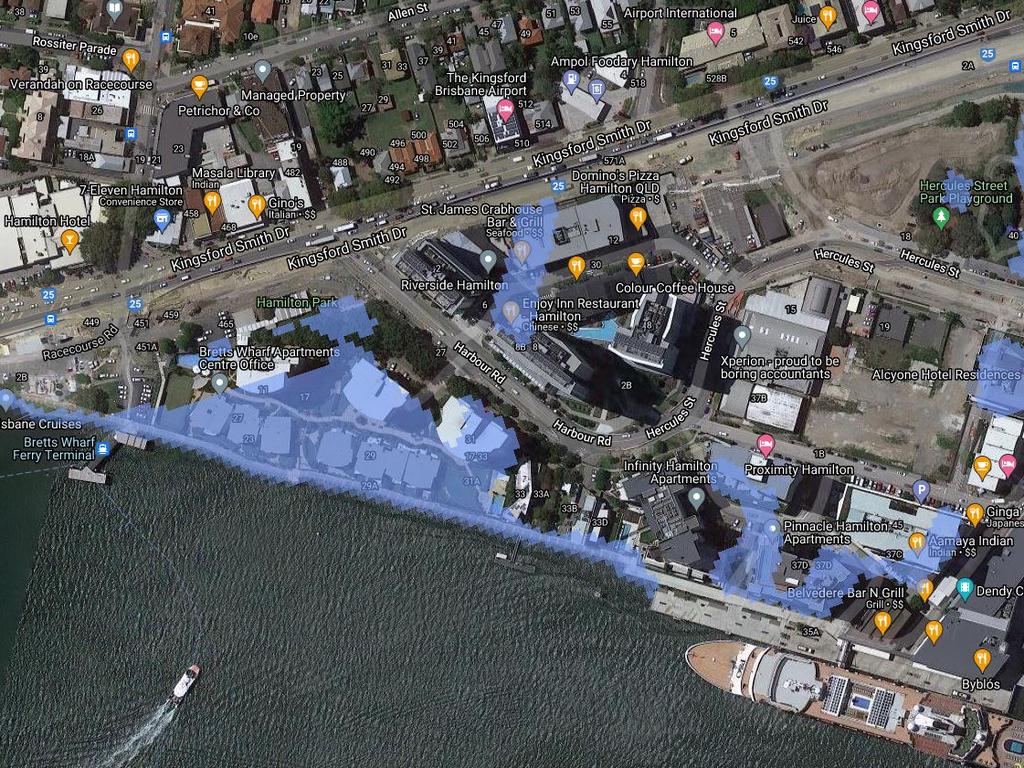
PORTSIDE WHARF, HAMILTON
|
|
Portside Wharf on the Brisbane River in Hamilton. |
|
|
Hamilton in 2100 as depicted by the Coastal Risk Australia Map.
|
The modelling portrays rivers and creeks rising as far west as Oxley, where the Ipswich Motorway could go under.
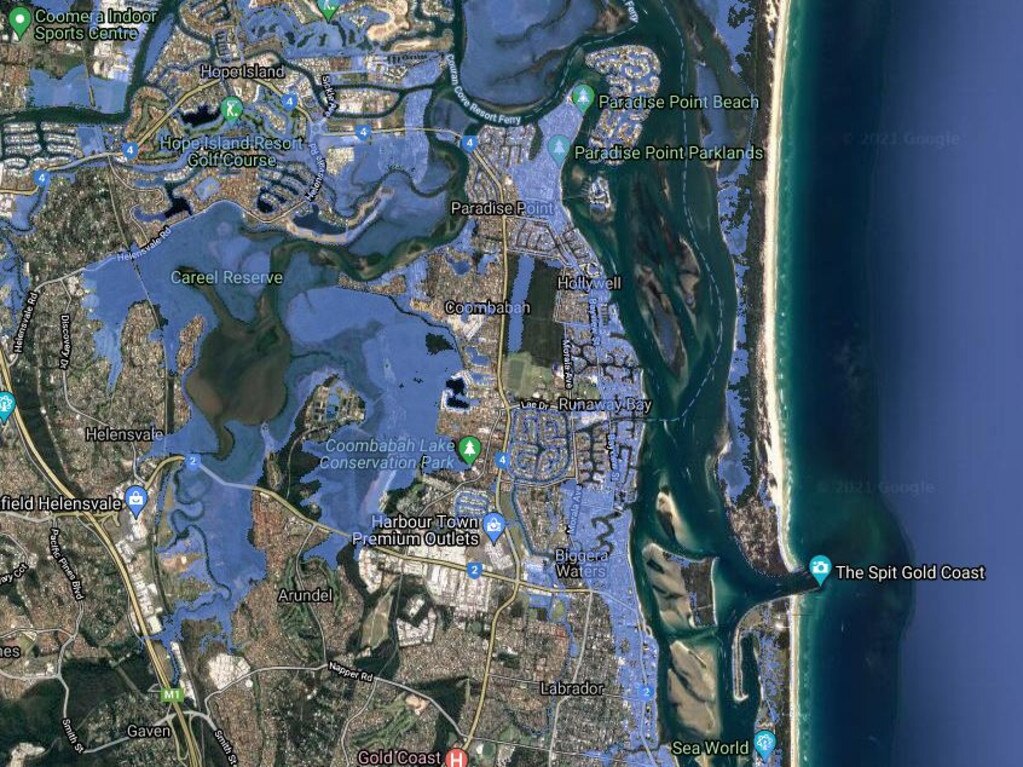
“On the Gold Coast the ‘A-line’ which is a buried rock wall that runs unobtrusively beneath many Gold Coast beaches is a critical last line of defence and should not be compromised by any public or private developments.
“Low-lying riverfront properties at places such as the Noosa River and the Nerang River and along Gold Coast suburbs such as Runaway Bay and Paradise Point are likely to see the first significant impacts and will need to prepare early to mitigate against them.”
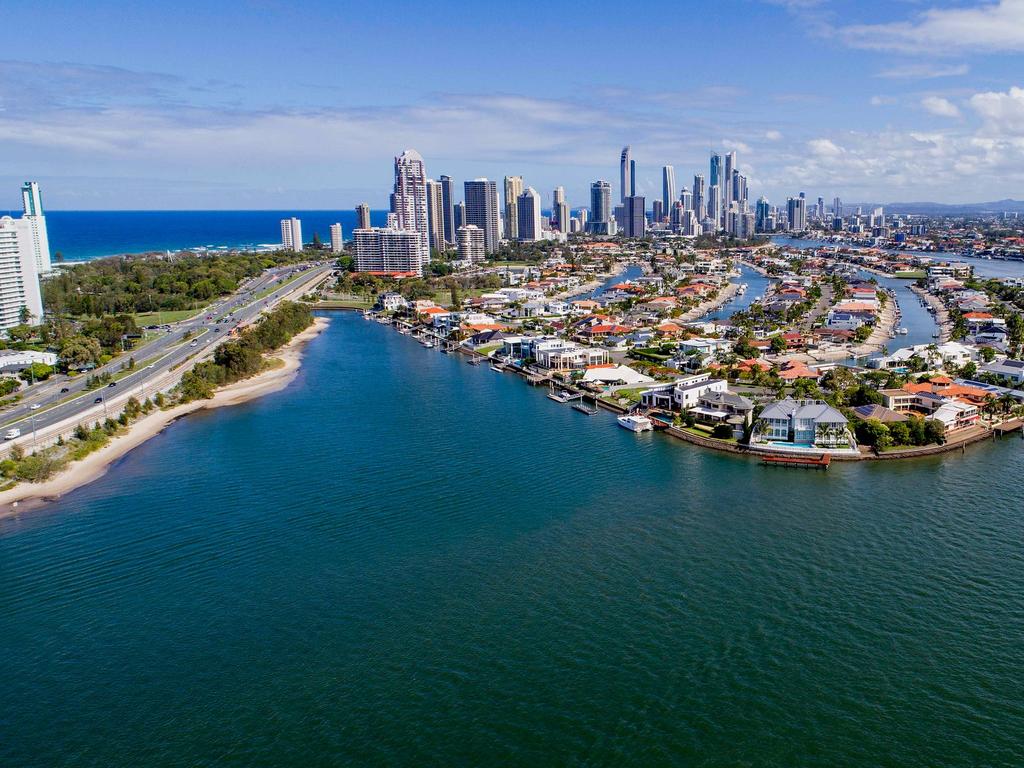
GOLD COAST
|
|
Low-lying riverfront properties on the Gold Coast are in the
firing line.
|
|
|
North Gold Coast in 2100 as depicted by the Coastal Risk Australia
Map. |
|
|
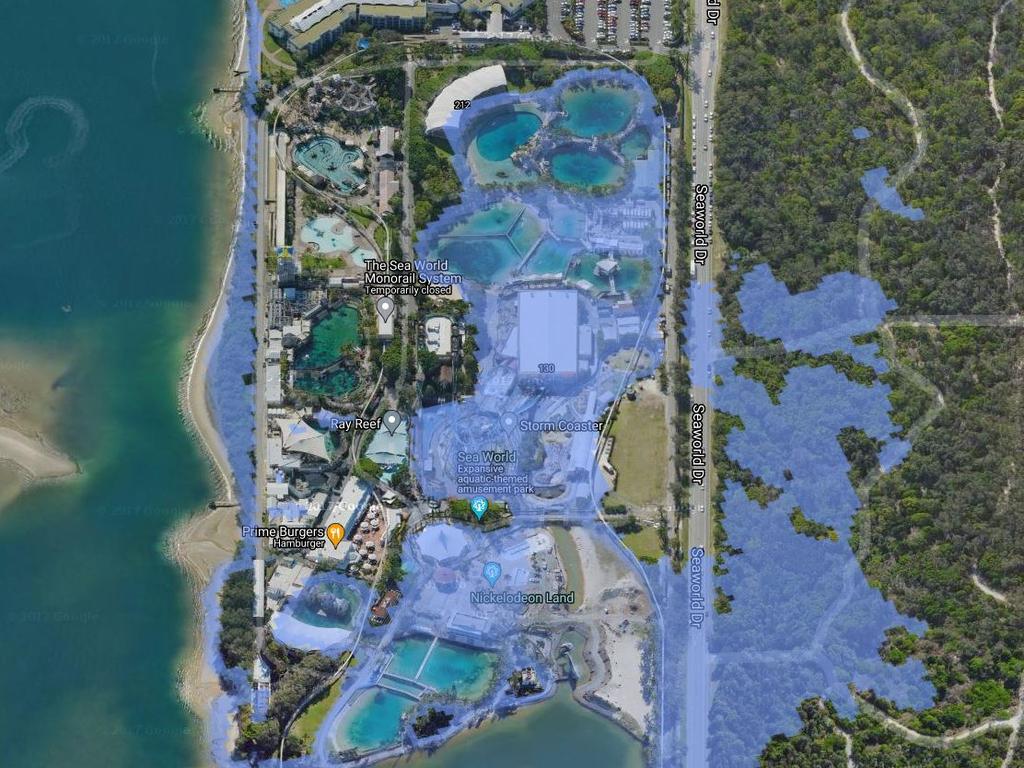
Sea World in 2100 as depicted by the Coastal Risk Australia Map. |
Dr McPhee said a reduction in greenhouse gas emissions could reduce the probability of the 0.84m sea level rise from happening.
But an even grimmer picture is painted by the map’s option to select a “very high scenario” modelled off a less likely sea level rise of 5m by 2150.
If climate change sends Queensland in that direction, the world can wave goodbye to Whitehaven Beach, Port Douglas, Wynnum and Manly’s foreshore and the Burleigh Pavilion.
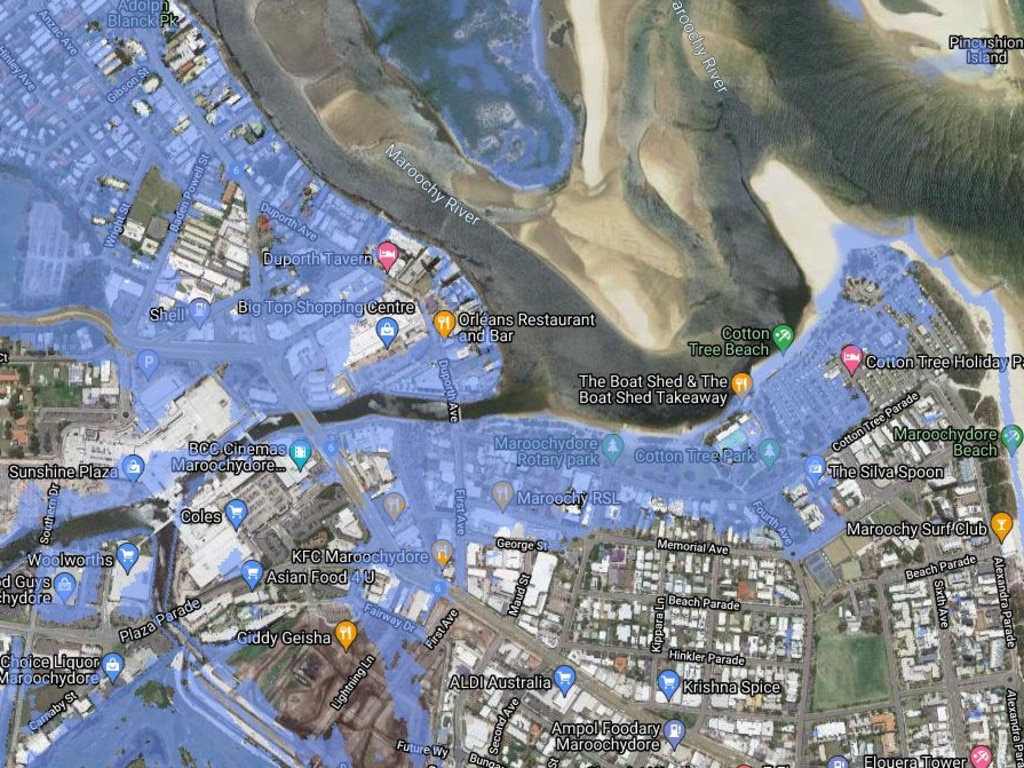
A 5m rise would also flood almost the entirety of Nudgee Beach, Maroochydore, Beachmere, Tweed Heads and Inskip.
Upon releasing the map, CEO of FrontierSI Graeme Kernich said the aim was to place scientific modelling into the hands of the people so they could see for themselves how the areas they live in could be impacted by climate change.
MAROOCHYDORE
|
|
Maroochydore in 2100 as depicted by the Coastal Risk Australia
Map.
|
The analysis by economists Kellie Bellrose, David Norman and Michelle Royters suggested there would be 254 climate-sensitive suburbs across Australia in 2050 which could see a 10 per cent fall in house prices.
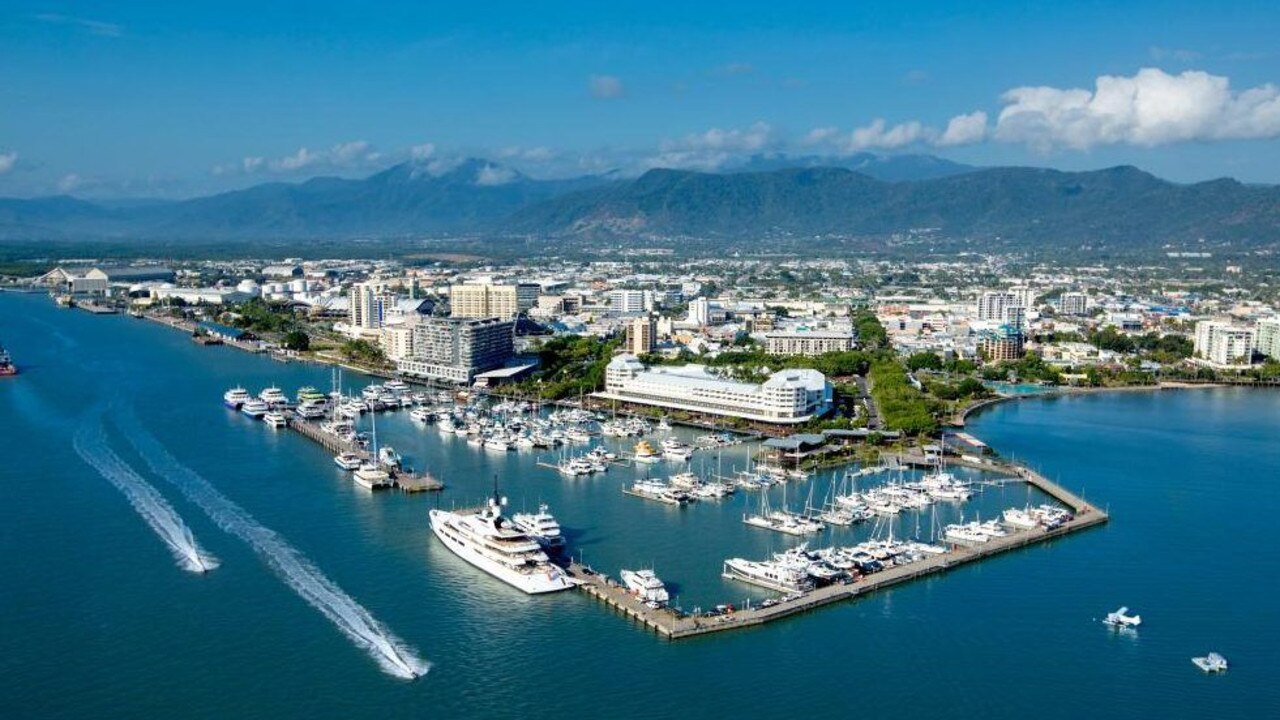
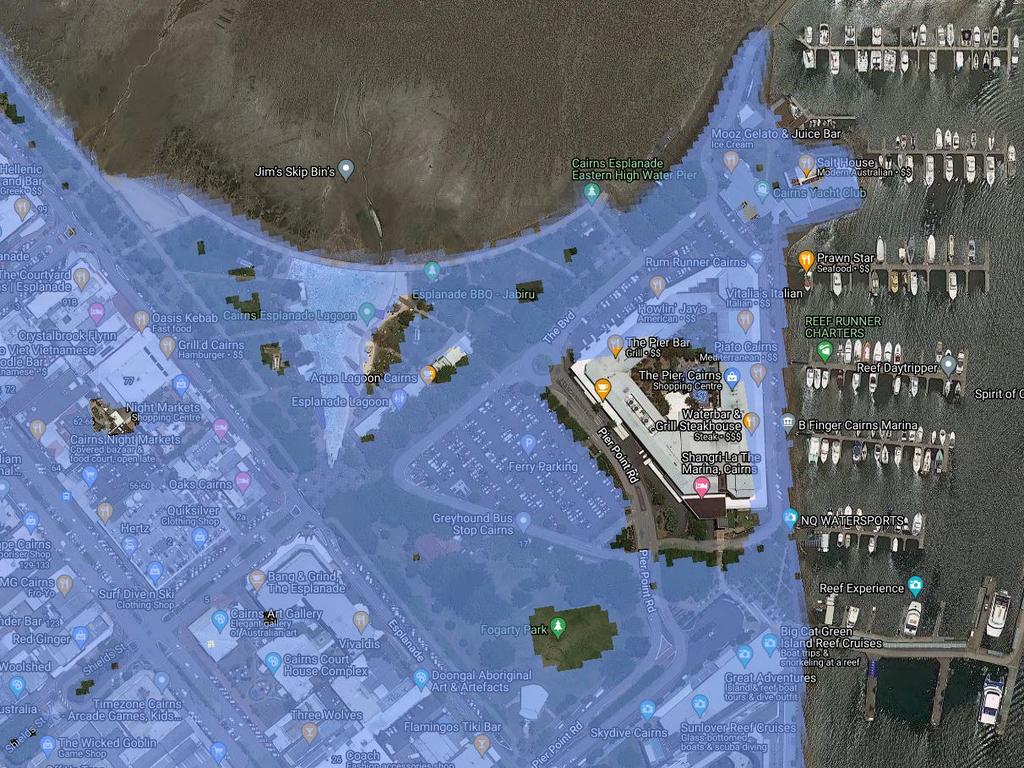
CAIRNS
|
|
Much of the Cairns waterfront would go under.
|
|
|
Cairns Esplanade in 2100 as depicted by the Coastal Risk
Australia Map.
|
“Within the major capital cities, where the majority of properties are located, the highest risk regions are mostly located on the coastline, particularly in Brisbane,” the paper stated.
“The risks in these regions could further increase if the affected communities find that access to, or affordability of, insurance becomes a challenge.”
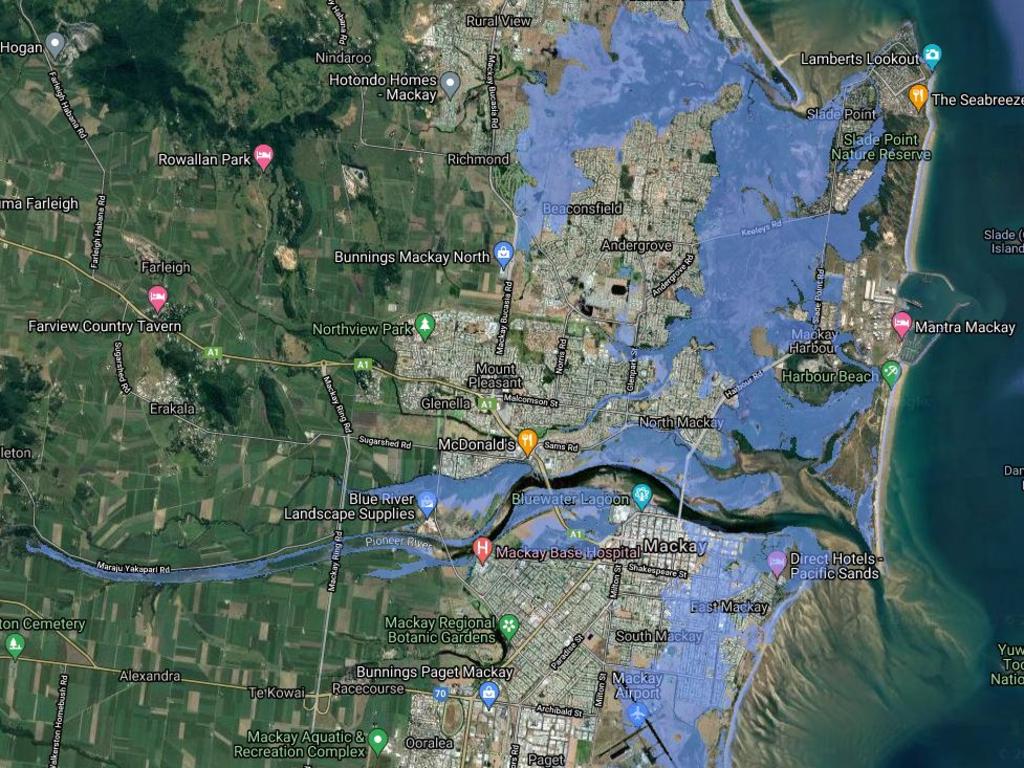
MACKAY
|
|
Mackay in 2100 as depicted by the Coastal Risk Australia Map.
|
Dr McPhee said the level of concern for property owners would be dependent on how they viewed their property as a long-term investment.
“They are highly unlikely to see any additional impacts of inundation in the five- to 10-year window, although if the investment is a generational investment modelling does determine that there will be some risk that may require mitigating and some risk to property values if inundation is frequent and significant,” he said.
“Insurance companies and banks will no doubt respond over time as climate change alters the risk profile of properties and respond.”
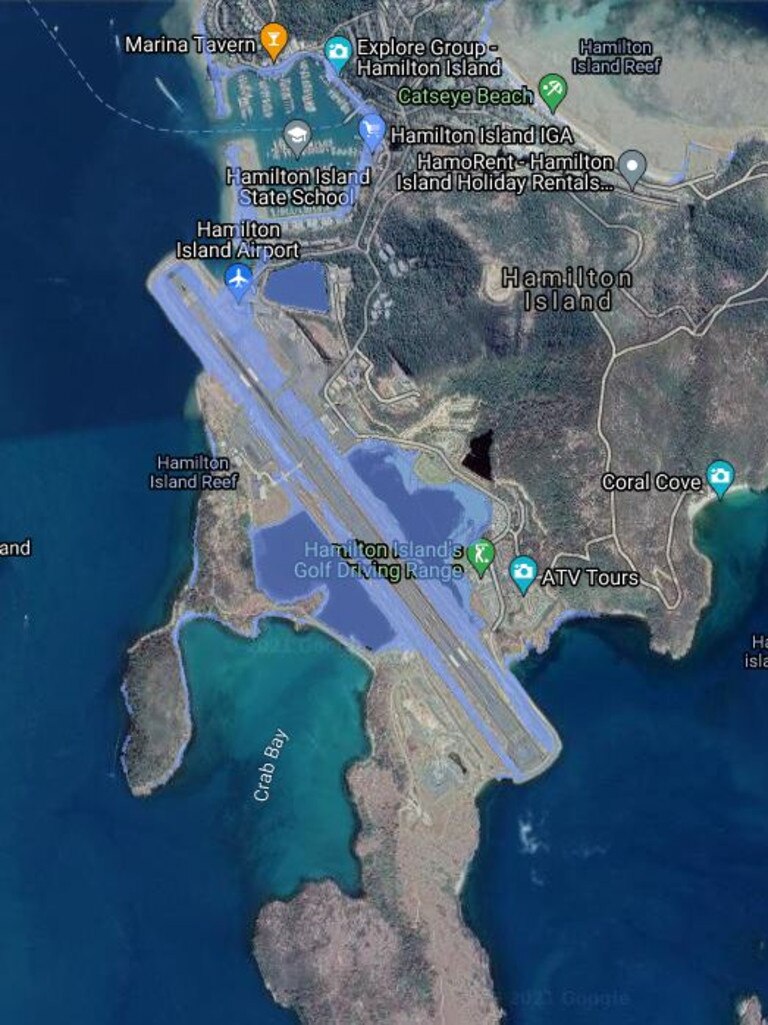
THE WHITSUNDAYS
|
|
Hamilton Island in 2100 as depicted by the Coastal Risk Australia
Map. |
|
|
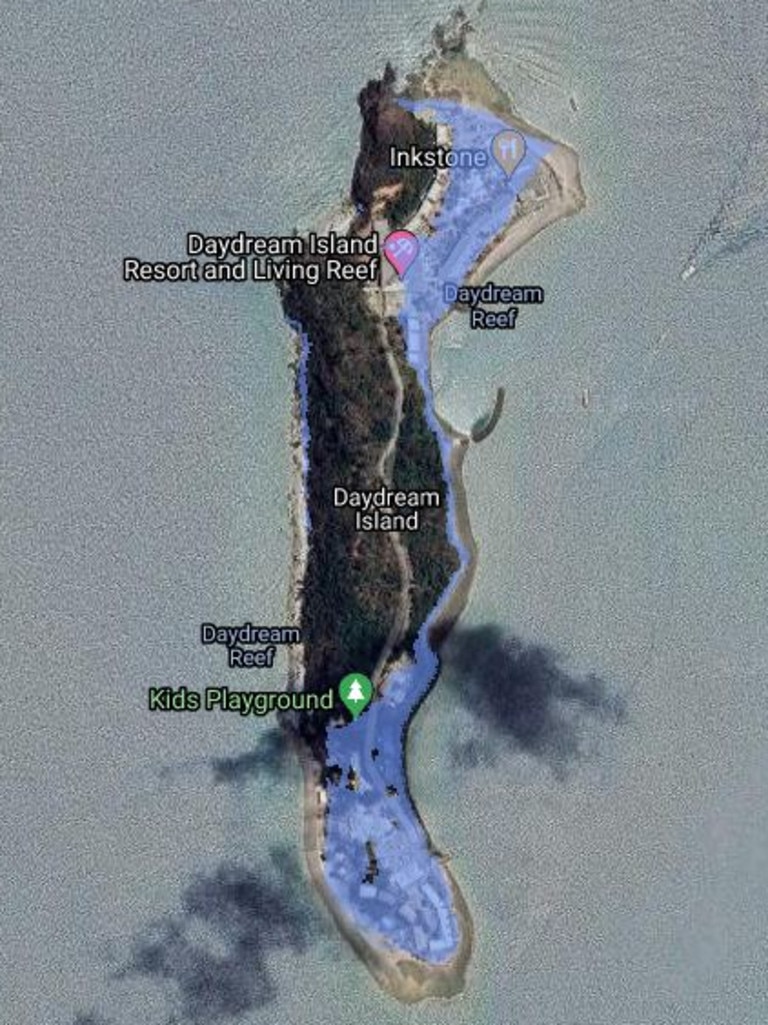
Daydream Island in 2100 as depicted by the Coastal Risk Australia
Map. |
SUBURBS THAT WOULD BE INUNDATED IN A HIGH-EMISSIONS SCENARIO
|
|
|
Links
No comments :
Post a Comment